Shasta Elementary School
Rating
Not Available
Not Available

No Reviews Yet
Find Old Friends From Shasta Elementary School
Use the form below to search for alumni from Shasta Elementary School.
School Description
School Summary and Highlights
- Enrolls 173 elementary school students from grades KG-8
- Ranks 1393rd out of 2,050 middle schools in CA.
- 2010 Overall School AYP Met Status: No
Additional Contact Information
- Mailing Address: PO Box 1125, Shasta, CA 96087
School Operational Details
- Title I EligibleAll students of this school are eligible for participation in authorized programs.
School District Details
- Shasta Union Elementary School District
- Per-Pupil Spending: $10,326
- Students Per Teacher: 19.2
- Enrolled Students: 173
Faculty Details and Student Enrollment
Students and Faculty
- Total Students Enrolled: 173
- Total Full Time "Equivalent" Teachers: 9.0
- Average Student-To-Teacher Ratio: 19.2
Students Gender Breakdown
- Males: 107 (61.8%)
- Females: 66 (38.2%)
Free Lunch Student Eligibility Breakdown
- Eligible for Reduced Lunch: 16 (9.2%)
- Eligible for Free Lunch: 66 (38.2%)
- Eligible for Either Reduced or Free Lunch: 82 (47.4%)
Student Enrollment Distribution by Race / Ethnicity
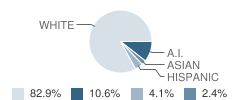
| Number | Percent | |
|---|---|---|
| American Indian | 18 | 10.4% |
| Black | - | - |
| Asian | 4 | 2.3% |
| Hispanic | 7 | 4.0% |
| White | 141 | 81.5% |
Number of Students Per Grade
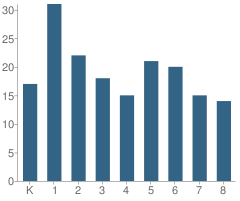
| Number | Percent | |
|---|---|---|
| Kindergarten | 17 | 9.8% |
| 1st Grade | 31 | 17.9% |
| 2nd Grade | 22 | 12.7% |
| 3rd Grade | 18 | 10.4% |
| 4th Grade | 15 | 8.7% |
| 5th Grade | 21 | 12.1% |
| 6th Grade | 20 | 11.6% |
| 7th Grade | 15 | 8.7% |
| 8th Grade | 14 | 8.1% |
Teacher Education Background (2009)
Percent With Ph.D.: 14.3%
Percent With Master's Degree: 28.6%
Teacher Credentials & Experience (2009)
Percent of Teachers With Credentials: 100.0%
Number of Certificated Staff: 7.0
Average Number of Years of Teacher Experience: 18.7
Average Age: 51.3
Source: CA Department of Education, Source: NCES 2009-2010
School Ratings and Reviews
Be The First To Review Shasta Elementary School!
School Map and Similar Schools Nearby
Click to Activate Map of Nearby School Campuses
Private
Public
This School
Similar Schools Nearby
| Grant Elementary School KG-8 | 598 Students | 2.9 miles away | Not Yet Rated | |
| Manzanita Elementary School KG-5 | 630 Students | 4.0 miles away | Not Yet Rated | |
| Buckeye Elementary School KG-6 | 523 Students | 5.2 miles away | Not Yet Rated | |
| Turtle Bay School KG-8 | 729 Students | 5.4 miles away |  5 out of 5 | |
| Sequoia Middle School 4-8 | 759 Students | 5.6 miles away |  4 out of 5 | |
| Cypress Elementary School KG-5 | 274 Students | 5.7 miles away | Not Yet Rated | |
| Juniper Academy KG-8 | 228 Students | 5.9 miles away | 5 out of 5 | |
| Bonny View Elementary School KG-5 | 289 Students | 6.6 miles away | Not Yet Rated | |
| Igo-Ono Elementary School KG-8 | 84 Students | 6.7 miles away | Not Yet Rated | |
| Sycamore Elementary School KG-5 | 225 Students | 7.0 miles away | Not Yet Rated | |
Compare This School To Nearby Schools ->
School Community Forum

Join a discussion about Shasta Elementary School and talk to others in the community including students, parents, teachers, and administrators.
Popular Discussion Topics
- Admissions and Registration Questions (e.g. Dress Code and Discipline Policy)
- School Calendar and Upcoming Events (e.g. Graduation)
- After School Programs, Extracurricular Activities, and Athletics (e.g. Football)
- News and Announcements (e.g. Yearbook and Class Supply List Details)
- Graduate and Alumni Events (e.g. Organizing Class Reunions)
Navigation
Can't Find What You Are Looking For?
Rankings
Nearby Cities
Sponsored Links
K-12 Articles

Bullycide: What is It and How Can It Be Prevented?
Disclaimer: This article expresses my opinion that has been formed by personal experience and...
Disclaimer: This article expresses my opinion that has been formed by personal experience and...

The Impact on Adopted Children at School
Children who are adopted can be affected both academically and socially at school. Many times...
Children who are adopted can be affected both academically and socially at school. Many times...

Simple Math ... a Simple Gift
Math affects every aspect of our lives-from balancing the checkbook to estimating the amount of...
Math affects every aspect of our lives-from balancing the checkbook to estimating the amount of...