Tomales High School

No Reviews Yet
Find Old Friends From Tomales High School
Use the form below to search for alumni from Tomales High School.
School Description
School Summary and Highlights
- Enrolls 183 high school students from grades 9-12
- Ranks 296th out of 1,197 high schools in CA.
- 2010 Overall School AYP Met Status: Yes
Additional Contact Information
- Mailing Address: PO Box 25, Tomales, CA 94971
School District Details
- Shoreline Unified School District
- Per-Pupil Spending: $19,328
- Graduation Rate: 74.1%
- Dropout Rate: 3.0%
- Students Per Teacher: 12.9
- Enrolled Students: 578
Faculty Details and Student Enrollment
Students and Faculty
- Total Students Enrolled: 183
- Total Full Time "Equivalent" Teachers: 15.4
- Average Student-To-Teacher Ratio: 11.9
Students Gender Breakdown
- Males: 88 (48.1%)
- Females: 95 (51.9%)
Free Lunch Student Eligibility Breakdown
- Eligible for Reduced Lunch: 29 (15.8%)
- Eligible for Free Lunch: 69 (37.7%)
- Eligible for Either Reduced or Free Lunch: 98 (53.6%)
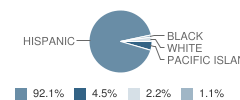
Student Enrollment Distribution by Race / Ethnicity

| Number | Percent | |
|---|---|---|
| American Indian | - | - |
| Black | 1 | 0.5% |
| Asian | - | - |
| Hispanic | 82 | 44.8% |
| White | 2 | 1.1% |
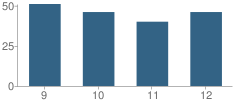
Number of Students Per Grade

| Number | Percent | |
|---|---|---|
| 9th Grade | 51 | 27.9% |
| 10th Grade | 46 | 25.1% |
| 11th Grade | 40 | 21.9% |
| 12th Grade | 46 | 25.1% |
Teacher Education Background (2009)
Percent With Master's Degree: 22.7%
Teacher Credentials & Experience (2009)
Percent of Teachers With Credentials: 100.0%
Number of Certificated Staff: 22.0
Average Number of Years of Teacher Experience: 17.2
Average Age
School:
45.1
District:
52.5
Source: CA Department of Education, Source: NCES 2009-2010
School Ratings and Reviews
Be The First To Review Tomales High School!
Sponsored Links
Test Scores and Performance Information
Overall School Rating
How is this determined?
The overall school rating shows that Tomales High School performed on average better than many other schools across the state on CST state exams in the following subjects:
- CST Algebra I
- CST Algebra II
- CST Biology
- CST Chemistry
- CST Earth Science
- CST English-Language Arts
- CST General Mathematics
- CST Geometry
- CST Science
- CST U.S. History
- CST World History
AYP Results (2010)
Overall AYP Met: Yes
ELA AYP Met: Yes
Math AYP Met: Yes
ACT Exam Results (2009)
Percent of Students Taking ACT Exam: 57.9%
Average Combined Score: 21.4
Percent Scoring At or Above 21: 68.2%
SAT Exam Results (2009)
Percent of Students Taking SAT Exam: 29.0%
Average Combined Score: 1,435.5
Critical Reading Average: 466.4
Math Average: 500.9
Writing Average: 468.2
Percent Scoring At or Above 1500: 36.4%
CST - Test Proficiency by Grade and Subject
Grade 9 - % of students at or above proficiency
| School | District | State | |
|---|---|---|---|
| CST Algebra I Test | |||
| 2010 | 38.0% | 38.0% | 22.0% |
| 2009 | 37.0% | 37.0% | 21.0% |
| 2008 | 57.0% | 57.0% | 18.0% |
| CST Biology Test | |||
| 2010 | 94.0% | 94.0% | 55.0% |
| CST Earth Science Test | |||
| 2010 | 38.0% | 38.0% | 35.0% |
| 2009 | 28.0% | 28.0% | 29.0% |
| 2008 | 31.0% | 31.0% | 31.0% |
| CST English-Language Arts Test | |||
| 2010 | 73.0% | 73.0% | 54.0% |
| 2009 | 57.0% | 57.0% | 50.0% |
| 2008 | 53.0% | 53.0% | 49.0% |
| CST Geometry Test | |||
| 2010 | 88.0% | 88.0% | 46.0% |
| 2009 | - | - | - |
| 2008 | 72.0% | 72.0% | 43.0% |
| CST General Mathematics Test | |||
| 2008 | 26.0% | 26.0% | 18.0% |
Grade 10 - % of students at or above proficiency
| School | District | State | |
|---|---|---|---|
| CST Algebra I Test | |||
| 2010 | 38.0% | 38.0% | 12.0% |
| 2009 | 24.0% | 24.0% | 11.0% |
| 2008 | 56.0% | 56.0% | 9.0% |
| CST Biology Test | |||
| 2010 | 42.0% | 42.0% | 38.0% |
| 2009 | 29.0% | 29.0% | 34.0% |
| 2008 | 40.0% | 40.0% | 35.0% |
| CST English-Language Arts Test | |||
| 2010 | 36.0% | 36.0% | 45.0% |
| 2009 | 36.0% | 36.0% | 44.0% |
| 2008 | 43.0% | 42.0% | 41.0% |
| CST Geometry Test | |||
| 2010 | 25.0% | 25.0% | 14.0% |
| 2009 | 18.0% | 18.0% | 14.0% |
| 2008 | 15.0% | 15.0% | 12.0% |
| CST Science Test | |||
| 2010 | 38.0% | 38.0% | 46.0% |
| 2009 | 41.0% | 41.0% | 44.0% |
| 2008 | 36.0% | 36.0% | 40.0% |
| CST World History Test | |||
| 2010 | 22.0% | 22.0% | 42.0% |
| 2009 | 32.0% | 32.0% | 38.0% |
| 2008 | 25.0% | 25.0% | 33.0% |
| CST Chemistry Test | |||
| 2008 | 36.0% | 36.0% | 41.0% |
Grade 11 - % of students at or above proficiency
| School | District | State | |
|---|---|---|---|
| CST Algebra I Test | |||
| 2010 | 9.0% | 9.0% | 8.0% |
| CST Algebra II Test | |||
| 2010 | 31.0% | 31.0% | 14.0% |
| 2009 | 33.0% | 33.0% | 12.0% |
| 2008 | 39.0% | 39.0% | 11.0% |
| CST Chemistry Test | |||
| 2010 | 47.0% | 47.0% | 30.0% |
| 2009 | 39.0% | 39.0% | 27.0% |
| 2008 | 16.0% | 16.0% | 25.0% |
| CST English-Language Arts Test | |||
| 2010 | 45.0% | 45.0% | 42.0% |
| 2009 | 25.0% | 25.0% | 40.0% |
| 2008 | 47.0% | 47.0% | 37.0% |
| CST U.S. History Test | |||
| 2010 | 53.0% | 53.0% | 45.0% |
| 2009 | 29.0% | 29.0% | 44.0% |
| 2008 | 42.0% | 42.0% | 38.0% |
End of Course - % of students at or above proficiency
| School | District | State | |
|---|---|---|---|
| CST Algebra I Test | |||
| 2010 | 33.0% | 43.0% | 31.0% |
| 2009 | 34.0% | 48.0% | 28.0% |
| 2008 | 56.0% | 62.0% | 25.0% |
| CST Algebra II Test | |||
| 2010 | 50.0% | 50.0% | 31.0% |
| 2009 | 46.0% | 46.0% | 28.0% |
| 2008 | 52.0% | 52.0% | 27.0% |
| CST Biology Test | |||
| 2010 | 56.0% | 56.0% | 46.0% |
| 2009 | 32.0% | 32.0% | 42.0% |
| 2008 | 48.0% | 48.0% | 42.0% |
| CST Chemistry Test | |||
| 2010 | 48.0% | 48.0% | 38.0% |
| 2009 | 41.0% | 41.0% | 36.0% |
| 2008 | 24.0% | 24.0% | 32.0% |
| CST Earth Science Test | |||
| 2010 | 37.0% | 37.0% | 33.0% |
| 2009 | 30.0% | 30.0% | 28.0% |
| 2008 | 28.0% | 28.0% | 28.0% |
| CST Geometry Test | |||
| 2010 | 44.0% | 45.0% | 27.0% |
| 2009 | 39.0% | 45.0% | 26.0% |
| 2008 | 33.0% | 33.0% | 24.0% |
| CST World History Test | |||
| 2010 | 22.0% | 22.0% | 41.0% |
| 2009 | 31.0% | 31.0% | 38.0% |
| 2008 | 25.0% | 25.0% | 33.0% |
| CST General Mathematics Test | |||
| 2008 | 26.0% | 60.0% | 27.0% |
Source: CA Department of Education 2009-2010
School Map and Similar Schools Nearby
Click to Activate Map of Nearby School Campuses
Private
Public
This School
Similar Schools Nearby
| Petaluma Junior High School 7-8 | 646 Students | 12.9 miles away | ![]() 5 out of 5 | |
| Rancho Cotate High School 9-12 | 1,549 Students | 13.1 miles away | ![]() 4 out of 5 | |
| Petaluma High School 9-12 | 1,365 Students | 13.6 miles away | Not Yet Rated | |
| Kenilworth Junior High School 7-8 | 1,012 Students | 13.9 miles away | ![]() 5 out of 5 | |
| Casa Grande High School 9-12 | 1,839 Students | 16.0 miles away | Not Yet Rated | |
| San Marin High School 9-12 | 950 Students | 17.8 miles away | ![]() 5 out of 5 | |
| Novato High School 9-12 | 1,322 Students | 20.7 miles away | ![]() 5 out of 5 | |
Compare This School To Nearby Schools ->
School Community Forum

Join a discussion about Tomales High School and talk to others in the community including students, parents, teachers, and administrators.
Popular Discussion Topics
- Admissions and Registration Questions (e.g. Dress Code and Discipline Policy)
- School Calendar and Upcoming Events (e.g. Graduation)
- After School Programs, Extracurricular Activities, and Athletics (e.g. Football)
- News and Announcements (e.g. Yearbook and Class Supply List Details)
- Graduate and Alumni Events (e.g. Organizing Class Reunions)
Navigation
Can't Find What You Are Looking For?
Rankings
Nearby Cities
Sponsored Links
K-12 Articles
Idle Hands
The worst affliction affecting our kids today is not teen pregnancy, drugs and alcohol, or...
Public or Private?
Daniel attended private school until sixth grade, when he was diagnosed with Asperger's Syndrome, a...
Break the Cycle: Teen Dating Violence and Prevention Week
February 5 through 9 was "National Teen Dating Violence Awareness and Prevention Week"....


