Santa Susana High School

No Reviews Yet
Find Old Friends From Santa Susana High School
Use the form below to search for alumni from Santa Susana High School.
School Description
School Summary and Highlights
- Enrolls 1,193 high school students from grades 9-12
- Ranks 181st out of 1,197 high schools in CA.
- 2010 Overall School AYP Met Status: Yes
Additional Contact Information
- Mailing Address: 3570 East Cochran St., Simi Valley, CA 93063
School District Details
- Simi Valley Unified School District
- Per-Pupil Spending: $8,013
- Graduation Rate: 79.2%
- Dropout Rate: 3.4%
- Students Per Teacher: 24.0
- Enrolled Students: 20,298
Faculty Details and Student Enrollment
Students and Faculty
- Total Students Enrolled: 1,193
- Total Full Time "Equivalent" Teachers: 48.3
- Average Student-To-Teacher Ratio: 24.7
Students Gender Breakdown
- Males: 510 (42.7%)
- Females: 683 (57.3%)
Free Lunch Student Eligibility Breakdown
- Eligible for Reduced Lunch: 66 (5.5%)
- Eligible for Free Lunch: 138 (11.6%)
- Eligible for Either Reduced or Free Lunch: 204 (17.1%)
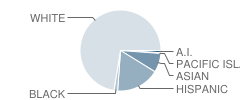
Student Enrollment Distribution by Race / Ethnicity

| Number | Percent | |
|---|---|---|
| American Indian | 12 | 1.0% |
| Black | 19 | 1.6% |
| Asian | 91 | 7.6% |
| Hispanic | 205 | 17.2% |
| White | 852 | 71.4% |
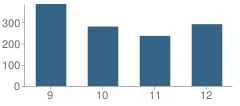
Number of Students Per Grade

| Number | Percent | |
|---|---|---|
| 9th Grade | 386 | 32.4% |
| 10th Grade | 280 | 23.5% |
| 11th Grade | 236 | 19.8% |
| 12th Grade | 291 | 24.4% |
Graduates Information (2010)
Graduation Rate
School:
96.5%
District:
91.2%
State:
78.6%
Teacher Education Background (2009)
Percent With Master's Degree
School:
35.1%
District:
54.3%
Percent With Bachelor's Degree
School:
59.6%
District:
31.4%
Teacher Credentials & Experience (2009)
Percent of Teachers With Credentials: 98.2%
Number of Certificated Staff: 57.0
Average Number of Years of Teacher Experience: 17.1
Average Age
School:
46.0
District:
50.7
Source: CA Department of Education, Source: NCES 2009-2010
School Ratings and Reviews
Be The First To Review Santa Susana High School!
Sponsored Links
Test Scores and Performance Information
Overall School Rating
How is this determined?
The overall school rating shows that Santa Susana High School performed on average better than many other schools across the state on CST state exams in the following subjects:
- CST Algebra I
- CST Algebra II
- CST Biology
- CST Chemistry
- CST Earth Science
- CST English-Language Arts
- CST General Mathematics
- CST Geometry
- CST Physics
- CST Science
- CST Summative High School Math
- CST U.S. History
- CST World History
AYP Results (2010)
Overall AYP Met: Yes
ELA AYP Met: Yes
Math AYP Met: Yes
ACT Exam Results (2009)
Percent of Students Taking ACT Exam: 12.7%
Average Combined Score: 23.7
Percent Scoring At or Above 21: 73.0%
SAT Exam Results (2009)
Percent of Students Taking SAT Exam: 34.7%
Average Combined Score: 1,635.5
Critical Reading Average: 557.5
Math Average: 541.3
Writing Average: 536.6
Percent Scoring At or Above 1500: 68.3%
CST - Test Proficiency by Grade and Subject
Grade 9 - % of students at or above proficiency
| School | District | State | |
|---|---|---|---|
| CST Algebra I Test | |||
| 2010 | 25.0% | 33.0% | 22.0% |
| 2009 | 36.0% | 39.0% | 21.0% |
| 2008 | 18.0% | 32.0% | 18.0% |
| CST Biology Test | |||
| 2010 | 92.0% | 78.0% | 55.0% |
| 2009 | 100.0% | 58.0% | 51.0% |
| CST Earth Science Test | |||
| 2010 | 67.0% | 62.0% | 35.0% |
| 2009 | 59.0% | 58.0% | 29.0% |
| 2008 | 57.0% | 57.0% | 31.0% |
| CST English-Language Arts Test | |||
| 2010 | 80.0% | 71.0% | 54.0% |
| 2009 | 80.0% | 66.0% | 50.0% |
| 2008 | 72.0% | 64.0% | 49.0% |
| CST General Mathematics Test | |||
| 2010 | 14.0% | 26.0% | 17.0% |
| 2009 | 6.0% | 24.0% | 17.0% |
| CST Geometry Test | |||
| 2010 | 51.0% | 58.0% | 46.0% |
| 2009 | 61.0% | 61.0% | 47.0% |
| 2008 | 44.0% | 61.0% | 43.0% |
Grade 10 - % of students at or above proficiency
| School | District | State | |
|---|---|---|---|
| CST Algebra I Test | |||
| 2010 | 28.0% | 15.0% | 12.0% |
| 2009 | 12.0% | 11.0% | 11.0% |
| 2008 | 17.0% | 13.0% | 9.0% |
| CST Algebra II Test | |||
| 2010 | 50.0% | 43.0% | 40.0% |
| 2009 | 38.0% | 51.0% | 37.0% |
| 2008 | 43.0% | 54.0% | 36.0% |
| CST Biology Test | |||
| 2010 | 74.0% | 61.0% | 38.0% |
| 2009 | 66.0% | 57.0% | 34.0% |
| 2008 | 73.0% | 59.0% | 35.0% |
| CST Chemistry Test | |||
| 2010 | 83.0% | 71.0% | 47.0% |
| CST English-Language Arts Test | |||
| 2010 | 65.0% | 52.0% | 45.0% |
| 2009 | 69.0% | 56.0% | 44.0% |
| 2008 | 70.0% | 54.0% | 41.0% |
| CST Geometry Test | |||
| 2010 | 18.0% | 13.0% | 14.0% |
| 2009 | 20.0% | 18.0% | 14.0% |
| 2008 | 22.0% | 20.0% | 12.0% |
| CST Science Test | |||
| 2010 | 80.0% | 63.0% | 46.0% |
| 2009 | 76.0% | 65.0% | 44.0% |
| 2008 | 73.0% | 62.0% | 40.0% |
| CST World History Test | |||
| 2010 | 63.0% | 51.0% | 42.0% |
| 2009 | 62.0% | 49.0% | 38.0% |
| 2008 | 54.0% | 47.0% | 33.0% |
Grade 11 - % of students at or above proficiency
| School | District | State | |
|---|---|---|---|
| CST Algebra I Test | |||
| 2010 | 8.0% | 7.0% | 8.0% |
| 2009 | 9.0% | 10.0% | 8.0% |
| 2008 | 15.0% | 13.0% | 5.0% |
| CST Algebra II Test | |||
| 2010 | 16.0% | 10.0% | 14.0% |
| 2009 | 10.0% | 12.0% | 12.0% |
| 2008 | 16.0% | 16.0% | 11.0% |
| CST Chemistry Test | |||
| 2010 | 39.0% | 41.0% | 30.0% |
| 2009 | 45.0% | 36.0% | 27.0% |
| 2008 | 37.0% | 36.0% | 25.0% |
| CST English-Language Arts Test | |||
| 2010 | 66.0% | 50.0% | 42.0% |
| 2009 | 63.0% | 49.0% | 40.0% |
| 2008 | 59.0% | 47.0% | 37.0% |
| CST Geometry Test | |||
| 2010 | 15.0% | 7.0% | 6.0% |
| 2009 | 14.0% | 10.0% | 7.0% |
| 2008 | 6.0% | 7.0% | 6.0% |
| CST Summative High School Math Test | |||
| 2010 | 39.0% | 52.0% | 50.0% |
| 2009 | 58.0% | 60.0% | 47.0% |
| 2008 | 47.0% | 50.0% | 43.0% |
| CST U.S. History Test | |||
| 2010 | 77.0% | 56.0% | 45.0% |
| 2009 | 74.0% | 57.0% | 44.0% |
| 2008 | 61.0% | 46.0% | 38.0% |
| CST Biology Test | |||
| 2009 | 72.0% | 51.0% | 41.0% |
| 2008 | 59.0% | 46.0% | 39.0% |
| CST Physics Test | |||
| 2008 | 72.0% | 84.0% | 47.0% |
End of Course - % of students at or above proficiency
| School | District | State | |
|---|---|---|---|
| CST Algebra I Test | |||
| 2010 | 24.0% | 41.0% | 31.0% |
| 2009 | 27.0% | 41.0% | 28.0% |
| 2008 | 17.0% | 37.0% | 25.0% |
| CST Algebra II Test | |||
| 2010 | 33.0% | 29.0% | 31.0% |
| 2009 | 22.0% | 35.0% | 28.0% |
| 2008 | 32.0% | 38.0% | 27.0% |
| CST Biology Test | |||
| 2010 | 75.0% | 59.0% | 46.0% |
| 2009 | 68.0% | 57.0% | 42.0% |
| 2008 | 71.0% | 57.0% | 42.0% |
| CST Chemistry Test | |||
| 2010 | 42.0% | 43.0% | 38.0% |
| 2009 | 46.0% | 38.0% | 36.0% |
| 2008 | 37.0% | 38.0% | 32.0% |
| CST Earth Science Test | |||
| 2010 | 67.0% | 59.0% | 33.0% |
| 2009 | 59.0% | 56.0% | 28.0% |
| 2008 | 57.0% | 54.0% | 28.0% |
| CST General Mathematics Test | |||
| 2010 | 14.0% | 40.0% | 27.0% |
| 2009 | 6.0% | 41.0% | 26.0% |
| CST Geometry Test | |||
| 2010 | 35.0% | 31.0% | 27.0% |
| 2009 | 31.0% | 33.0% | 26.0% |
| 2008 | 23.0% | 33.0% | 24.0% |
| CST Summative High School Math Test | |||
| 2010 | 40.0% | 53.0% | 54.0% |
| 2009 | 59.0% | 61.0% | 50.0% |
| 2008 | 50.0% | 52.0% | 47.0% |
| CST World History Test | |||
| 2010 | 63.0% | 50.0% | 41.0% |
| 2009 | 60.0% | 48.0% | 38.0% |
| 2008 | 54.0% | 45.0% | 33.0% |
| CST Physics Test | |||
| 2008 | 72.0% | 84.0% | 43.0% |
Source: CA Department of Education 2009-2010
School Map and Similar Schools Nearby
Click to Activate Map of Nearby School Campuses
Private
Public
This School
Similar Schools Nearby
| Simi Valley High School 9-12 | 2,710 Students | 2.3 miles away | Not Yet Rated | |
| Royal High School 9-12 | 2,557 Students | 2.8 miles away | Not Yet Rated | |
| The High School at Moorpark College 11-12 | 122 Students | 6.2 miles away | Not Yet Rated | |
| Moorpark High School 9-12 | 2,369 Students | 9.9 miles away | Not Yet Rated | |
| Fillmore High School 9-12 | 1,137 Students | 13.7 miles away | ![]() 3.5 out of 5 | |
| Adolfo Camarillo High School 9-12 | 2,401 Students | 16.6 miles away | ![]() 5 out of 5 | |
| Santa Paula High School 9-12 | 1,524 Students | 20.3 miles away | Not Yet Rated | |
| Rio Mesa High School 9-12 | 2,205 Students | 24.1 miles away | Not Yet Rated | |
| Ocean View Junior High School 6-8 | 795 Students | 25.5 miles away | ![]() 5 out of 5 | |
| Channel Islands High School 9-12 | 2,761 Students | 25.9 miles away | Not Yet Rated | |
Compare This School To Nearby Schools ->
School Community Forum

Join a discussion about Santa Susana High School and talk to others in the community including students, parents, teachers, and administrators.
Popular Discussion Topics
- Admissions and Registration Questions (e.g. Dress Code and Discipline Policy)
- School Calendar and Upcoming Events (e.g. Graduation)
- After School Programs, Extracurricular Activities, and Athletics (e.g. Football)
- News and Announcements (e.g. Yearbook and Class Supply List Details)
- Graduate and Alumni Events (e.g. Organizing Class Reunions)
Navigation
Can't Find What You Are Looking For?
Rankings
Nearby Cities
Sponsored Links
K-12 Articles
Help Your Child Achieve Success in Middle School
Middle school is for children between the ages of 10 and 14 years. At this time children begin to...
Information on Cyberbullying
What is Cyberbullying? Cyberbullying is a new form of harassment, emotional abuse,...
Simple Math ... a Simple Gift
Math affects every aspect of our lives-from balancing the checkbook to estimating the amount of...


