Snelling-Merced Falls Elementary School
Rating
Not Available
Not Available

5 out of 5 | 1 Review
Find Old Friends From Snelling-Merced Falls Elementary School
Use the form below to search for alumni from Snelling-Merced Falls Elementary School.
School Description
School Summary and Highlights
- Enrolls 81 elementary school students from grades KG-8
- Ranks 347th out of 2,050 middle schools in CA.
- 2010 Overall School AYP Met Status: Yes
Additional Contact Information
- Mailing Address: PO Box 189, Snelling, CA 95369
School Operational Details
- Title I Eligible
School District Details
- Snelling-Merced Falls Union Elementary School District
- Per-Pupil Spending: $11,164
- Students Per Teacher: 16.4
- Enrolled Students: 81
Faculty Details and Student Enrollment
Students and Faculty
- Total Students Enrolled: 81
- Total Full Time "Equivalent" Teachers: 5.0
- Average Student-To-Teacher Ratio: 16.4
Students Gender Breakdown
- Males: 38 (46.9%)
- Females: 43 (53.1%)
Free Lunch Student Eligibility Breakdown
- Eligible for Reduced Lunch: 8 (9.9%)
- Eligible for Free Lunch: 42 (51.9%)
- Eligible for Either Reduced or Free Lunch: 50 (61.7%)
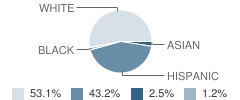
Student Enrollment Distribution by Race / Ethnicity
| Number | Percent | |
|---|---|---|
| American Indian | - | - |
| Black | 1 | 1.2% |
| Asian | 2 | 2.5% |
| Hispanic | 35 | 43.2% |
| White | 43 | 53.1% |
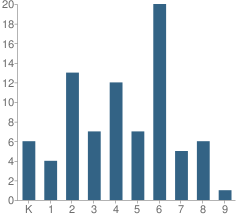
Number of Students Per Grade
| Number | Percent | |
|---|---|---|
| Kindergarten | 6 | 7.4% |
| 1st Grade | 4 | 4.9% |
| 2nd Grade | 13 | 16.0% |
| 3rd Grade | 7 | 8.6% |
| 4th Grade | 12 | 14.8% |
| 5th Grade | 7 | 8.6% |
| 6th Grade | 20 | 24.7% |
| 7th Grade | 5 | 6.2% |
| 8th Grade | 6 | 7.4% |
| 9th Grade | 1 | 1.2% |
Teacher Credentials & Experience (2009)
Percent of Teachers With Credentials: 100.0%
Number of Certificated Staff: 6.0
Average Number of Years of Teacher Experience: 10.8
Average Age: 48.3
Source: CA Department of Education, Source: NCES 2009-2010
School Ratings and Reviews
Overall Rating: 5

5 out of 5 | 1 Review
The Overall Rating is the school's average rating from parents, students, school faculty and staff. The highest rating is five apples and the lowest is one apple.
Share Your Review About This School
1 review for Snelling-Merced Falls Elementary School
- Reviewed by Student on November 23, 2009
- Rating:
 (5 / 5) Flag as inappropriate
 - This school is so much fun!
School Map and Similar Schools Nearby
Click to Activate Map of Nearby School Campuses
Private
Public
This School
Similar Schools Nearby
| Hopeton Elementary School KG-3 | 80 Students | 5.5 miles away | Not Yet Rated | |
| Washington Elementary School 4-8 | 105 Students | 9.4 miles away | Not Yet Rated | |
| La Grange Elementary School KG-8 | 13 Students | 9.8 miles away | Not Yet Rated | - |
| Lake Don Pedro Elementary School KG-8 | 202 Students | 11.2 miles away |  5 out of 5 | |
| Roberts Ferry Union Elementary School KG-8 | 110 Students | 12.9 miles away | Not Yet Rated | |
| Winfield Elementary School KG-5 | 434 Students | 13.1 miles away | Not Yet Rated | - |
| Allan Peterson Elementary School KG-5 | 752 Students | 13.5 miles away | 5 out of 5 | |
| Sybil N. Crookham Elementary School KG-5 | 403 Students | 13.6 miles away | 5 out of 5 | |
| Peggy Heller Elementary School KG-6 | 374 Students | 13.8 miles away |  4 out of 5 | |
| Bellevue Elementary School KG-8 | 909 Students | 14.0 miles away | 5 out of 5 | |
Compare This School To Nearby Schools ->
Navigation
Can't Find What You Are Looking For?
Rankings
Nearby Cities
Sponsored Links
K-12 Articles

Democracy in Action
There is still over a year until the general election, but the election cycle has been in full...
There is still over a year until the general election, but the election cycle has been in full...

Teaching Children a Love of History
Parents and grandparents are responsible for teaching children a love of history. To begin, relate...
Parents and grandparents are responsible for teaching children a love of history. To begin, relate...

Hurt: A Book Report
My last book report was over 15 years ago, and I’m a bit rusty, but here goes (Don’t forget: book...
My last book report was over 15 years ago, and I’m a bit rusty, but here goes (Don’t forget: book...