Options for Youth-Victorville Charter School

No Reviews Yet
Find Old Friends From Options for Youth-Victorville Charter School
Use the form below to search for alumni from Options for Youth-Victorville Charter School.
School Description
School Summary and Highlights
- Enrolls 2,018 middle and high school students from grades 7-12
- Ranks 1147th out of 1,197 high schools in CA.
- 2010 Overall School AYP Met Status: No
Additional Contact Information
- Mailing Address: 199 South Los Robles Ave., Ste, Pasadena, CA 91101
School Operational Details
- Charter School
School District Details
- Victor Valley Union High School District
- Per-Pupil Spending: $6,495
- Graduation Rate: 68.1%
- Dropout Rate: 11.4%
- Students Per Teacher: 23.2
- Enrolled Students: 13,993
Faculty Details and Student Enrollment
Students and Faculty
- Total Students Enrolled: 2,018
- Total Full Time "Equivalent" Teachers: 124.3
- Average Student-To-Teacher Ratio: 16.2
Students Gender Breakdown
- Males: 913 (45.2%)
- Females: 1,105 (54.8%)
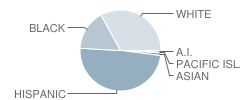
Student Enrollment Distribution by Race / Ethnicity

| Number | Percent | |
|---|---|---|
| American Indian | 15 | 0.7% |
| Black | 308 | 15.3% |
| Asian | 22 | 1.1% |
| Hispanic | 928 | 46.0% |
| White | 627 | 31.1% |
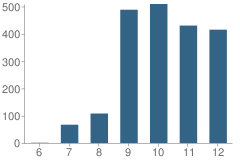
Number of Students Per Grade

| Number | Percent | |
|---|---|---|
| 6th Grade | 1 | 0.05% |
| 7th Grade | 67 | 3.3% |
| 8th Grade | 108 | 5.4% |
| 9th Grade | 488 | 24.2% |
| 10th Grade | 509 | 25.2% |
| 11th Grade | 430 | 21.3% |
| 12th Grade | 415 | 20.6% |
Graduates Information (2010)
Graduation Rate
School:
31.4%
District:
69.6%
State:
78.6%
Teacher Education Background (2009)
Percent With Ph.D.
School:
5.5%
District:
11.8%
Percent With Master's Degree
School:
16.5%
District:
41.2%
Percent With Bachelor's Degree: 28.6%
Teacher Credentials & Experience (2009)
Percent of Teachers With Emergency Credentials: 11.1%
Percent of Teachers With Credentials: 87.3%
Number of Certificated Staff: 91.0
Average Number of Years of Teacher Experience: 9.0
Average Age
School:
39.7
District:
48.7
Source: CA Department of Education, Source: NCES 2009-2010
School Ratings and Reviews
Be The First To Review Options for Youth-Victorville Charter School!
Sponsored Links
Test Scores and Performance Information
Overall School Rating
How is this determined?
The overall school rating shows that Options for Youth-Victorville Charter School performed on average much worse than most other schools across the state on CST state exams in the following subjects:
- CST Algebra I
- CST Algebra II
- CST Biology
- CST English-Language Arts
- CST General Mathematics
- CST Geometry
- CST History - Social Science
- CST Mathematics
- CST Science
- CST U.S. History
- CST World History
AYP Results (2010)
Overall AYP Met: No
ELA AYP Met: No
Math AYP Met: No
SAT Exam Results (2009)
Percent of Students Taking SAT Exam: 0.8%
CST - Test Proficiency by Grade and Subject
Grade 7 - % of students at or above proficiency
| School | District | State | |
|---|---|---|---|
| CST English-Language Arts Test | |||
| 2010 | 30.0% | 44.0% | 55.0% |
| 2009 | 25.0% | 42.0% | 54.0% |
| 2008 | 23.0% | 34.0% | 49.0% |
| CST Mathematics Test | |||
| 2010 | 18.0% | 45.0% | 48.0% |
| 2009 | 8.0% | 39.0% | 43.0% |
| 2008 | 13.0% | 32.0% | 41.0% |
Grade 8 - % of students at or above proficiency
| School | District | State | |
|---|---|---|---|
| CST Algebra I Test | |||
| 2010 | 3.0% | 33.0% | 46.0% |
| 2009 | - | - | - |
| 2008 | 11.0% | 44.0% | 42.0% |
| CST English-Language Arts Test | |||
| 2010 | 28.0% | 44.0% | 54.0% |
| 2009 | 20.0% | 36.0% | 48.0% |
| 2008 | 26.0% | 34.0% | 45.0% |
| CST General Mathematics Test | |||
| 2010 | 8.0% | - | 30.0% |
| 2009 | 10.0% | 9.0% | 30.0% |
| 2008 | 14.0% | 13.0% | 31.0% |
| CST History - Social Science Test | |||
| 2010 | 11.0% | 31.0% | 47.0% |
| 2009 | 10.0% | 25.0% | 42.0% |
| 2008 | 6.0% | 20.0% | 36.0% |
| CST Science Test | |||
| 2010 | 18.0% | 44.0% | 59.0% |
| 2009 | 11.0% | 42.0% | 56.0% |
| 2008 | 13.0% | 40.0% | 52.0% |
Grade 9 - % of students at or above proficiency
| School | District | State | |
|---|---|---|---|
| CST Algebra I Test | |||
| 2010 | 3.0% | 15.0% | 22.0% |
| 2009 | 11.0% | 10.0% | 21.0% |
| 2008 | 6.0% | 12.0% | 18.0% |
| CST English-Language Arts Test | |||
| 2010 | 33.0% | 43.0% | 54.0% |
| 2009 | 33.0% | 38.0% | 50.0% |
| 2008 | 32.0% | 35.0% | 49.0% |
| CST General Mathematics Test | |||
| 2010 | 11.0% | - | 17.0% |
| 2009 | 22.0% | - | 17.0% |
| 2008 | 17.0% | 10.0% | 18.0% |
| CST Geometry Test | |||
| 2010 | 5.0% | 25.0% | 46.0% |
| 2009 | - | - | - |
| 2008 | 5.0% | 17.0% | 43.0% |
| CST World History Test | |||
| 2010 | 13.0% | 12.0% | 45.0% |
| 2009 | 19.0% | 17.0% | 41.0% |
| 2008 | 6.0% | 5.0% | 36.0% |
| CST Biology Test | |||
| 2008 | 9.0% | 41.0% | 52.0% |
Grade 10 - % of students at or above proficiency
| School | District | State | |
|---|---|---|---|
| CST Algebra I Test | |||
| 2010 | 5.0% | 11.0% | 12.0% |
| 2009 | 14.0% | 4.0% | 11.0% |
| 2008 | 4.0% | 5.0% | 9.0% |
| CST English-Language Arts Test | |||
| 2010 | 24.0% | 36.0% | 45.0% |
| 2009 | 27.0% | 31.0% | 44.0% |
| 2008 | 25.0% | 34.0% | 41.0% |
| CST Geometry Test | |||
| 2010 | 3.0% | 15.0% | 14.0% |
| 2009 | 3.0% | 10.0% | 14.0% |
| CST Science Test | |||
| 2010 | 14.0% | 32.0% | 46.0% |
| 2009 | 19.0% | 29.0% | 44.0% |
| 2008 | 12.0% | 28.0% | 40.0% |
| CST World History Test | |||
| 2010 | 16.0% | 24.0% | 42.0% |
| 2009 | 17.0% | 22.0% | 38.0% |
| 2008 | 9.0% | 20.0% | 33.0% |
| CST Biology Test | |||
| 2008 | 25.0% | 32.0% | 35.0% |
Grade 11 - % of students at or above proficiency
| School | District | State | |
|---|---|---|---|
| CST Algebra I Test | |||
| 2010 | 2.0% | 5.0% | 8.0% |
| 2009 | 13.0% | 5.0% | 8.0% |
| CST English-Language Arts Test | |||
| 2010 | 17.0% | 32.0% | 42.0% |
| 2009 | 22.0% | 30.0% | 40.0% |
| 2008 | 13.0% | 30.0% | 37.0% |
| CST U.S. History Test | |||
| 2010 | 12.0% | 33.0% | 45.0% |
| 2009 | 12.0% | 31.0% | 44.0% |
| 2008 | 8.0% | 30.0% | 38.0% |
| CST World History Test | |||
| 2010 | 11.0% | 12.0% | 15.0% |
| 2009 | 18.0% | 8.0% | 11.0% |
| 2008 | 8.0% | 7.0% | 9.0% |
| CST Geometry Test | |||
| 2008 | 6.0% | 8.0% | 6.0% |
End of Course - % of students at or above proficiency
| School | District | State | |
|---|---|---|---|
| CST Algebra I Test | |||
| 2010 | 3.0% | 20.0% | 31.0% |
| 2009 | 12.0% | 13.0% | 28.0% |
| 2008 | 5.0% | 18.0% | 25.0% |
| CST Algebra II Test | |||
| 2010 | 6.0% | 19.0% | 31.0% |
| 2009 | - | - | - |
| 2008 | 6.0% | 15.0% | 27.0% |
| CST General Mathematics Test | |||
| 2010 | 10.0% | - | 27.0% |
| 2009 | 18.0% | 8.0% | 26.0% |
| 2008 | 16.0% | 12.0% | 27.0% |
| CST Geometry Test | |||
| 2010 | 3.0% | 20.0% | 27.0% |
| 2009 | 3.0% | 14.0% | 26.0% |
| 2008 | 3.0% | 13.0% | 24.0% |
| CST World History Test | |||
| 2010 | 15.0% | 22.0% | 41.0% |
| 2009 | 17.0% | 21.0% | 38.0% |
| 2008 | 8.0% | 18.0% | 33.0% |
| CST Biology Test | |||
| 2008 | 19.0% | 38.0% | 42.0% |
Source: CA Department of Education 2009-2010
School Map and Similar Schools Nearby
Click to Activate Map of Nearby School Campuses
Private
Public
This School
Similar Schools Nearby
| Alta Vista Public School KG-12 | 171 Students | 2.5 miles away | Not Yet Rated | - |
| Encore High School for the Performing and Visual Arts 7-12 | 620 Students | 3.2 miles away | ![]() 5 out of 5 | - |
| Mirus Secondary School 7-12 | 172 Students | 3.3 miles away | Not Yet Rated | - |
| Crosswalk: Hesperia Experiential Learning Pathways School 9-12 | 88 Students | 4.2 miles away | ![]() 5 out of 5 | |
| High Desert Academy of Applied Arts and Sciences 7-12 | 102 Students | 4.3 miles away | Not Yet Rated | |
| Summit Leadership Academy-High Desert 9-12 | 189 Students | 4.8 miles away | ![]() 5 out of 5 | |
| Academy for Academic Excellence KG-12 | 1,335 Students | 5.4 miles away | Not Yet Rated | |
| Riverside Preparatory School KG-12 | 1,035 Students | 8.8 miles away | ![]() 5 out of 5 | - |
| Academy of Careers & Exploration KG-12 | 121 Students | 18.6 miles away | Not Yet Rated | - |
| Provisional Accelerated Learning Academy 9-12 | 256 Students | 22.2 miles away | Not Yet Rated | |
Compare This School To Nearby Schools ->
School Community Forum

Join a discussion about Options for Youth-Victorville Charter School and talk to others in the community including students, parents, teachers, and administrators.
Popular Discussion Topics
- Admissions and Registration Questions (e.g. Dress Code and Discipline Policy)
- School Calendar and Upcoming Events (e.g. Graduation)
- After School Programs, Extracurricular Activities, and Athletics (e.g. Football)
- News and Announcements (e.g. Yearbook and Class Supply List Details)
- Graduate and Alumni Events (e.g. Organizing Class Reunions)
Navigation
Can't Find What You Are Looking For?
Rankings
Nearby Cities
Sponsored Links
K-12 Articles
The Difference Between Boys and Girls
Boys and girls are different. Give a toddler girl a G.I. Joe and she'll probably try to mother it....
The Impact on Adopted Children at School
Children who are adopted can be affected both academically and socially at school. Many times...
Teaching Your Kids About Respect, Values and Violence
These days it seems that every newscast reports at least once incident of violence. As parents, we...

