Excelsior Education Center School
12217 Spring Valley Parkway, Victorville, CA 92395 | (760) 245-4448
- Grades: 7-12
- Student Enrollment: 1,100

No Reviews Yet
Find Old Friends From Excelsior Education Center School
Use the form below to search for alumni from Excelsior Education Center School.
School Description
School Summary and Highlights
- Enrolls 1,100 middle and high school students from grades 7-12
- Ranks 800th out of 1,197 high schools in CA.
- 2010 Overall School AYP Met Status: No
Additional Contact Information
- Mailing Address: 7151 Svl Box, Victorville, CA 92395
School Operational Details
- Title I Eligible
- Charter School
School District Details
- Victor Valley Union High School District
- Per-Pupil Spending: $6,495
- Graduation Rate: 68.1%
- Dropout Rate: 11.4%
- Students Per Teacher: 23.2
- Enrolled Students: 13,993
Faculty Details and Student Enrollment
Students and Faculty
- Total Students Enrolled: 1,100
- Total Full Time "Equivalent" Teachers: 37.3
- Average Student-To-Teacher Ratio: 29.5
Students Gender Breakdown
- Males: 518 (47.1%)
- Females: 582 (52.9%)
Free Lunch Student Eligibility Breakdown
- Eligible for Reduced Lunch: 150 (13.6%)
- Eligible for Free Lunch: 314 (28.5%)
- Eligible for Either Reduced or Free Lunch: 464 (42.2%)
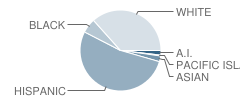
Student Enrollment Distribution by Race / Ethnicity

| Number | Percent | |
|---|---|---|
| American Indian | 13 | 1.2% |
| Black | 39 | 3.5% |
| Asian | 16 | 1.5% |
| Hispanic | 349 | 31.7% |
| White | 241 | 21.9% |
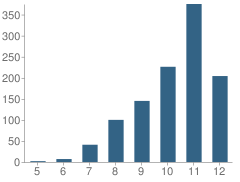
Number of Students Per Grade

| Number | Percent | |
|---|---|---|
| 5th Grade | 2 | 0.2% |
| 6th Grade | 7 | 0.6% |
| 7th Grade | 41 | 3.7% |
| 8th Grade | 100 | 9.1% |
| 9th Grade | 145 | 13.2% |
| 10th Grade | 226 | 20.5% |
| 11th Grade | 375 | 34.1% |
| 12th Grade | 204 | 18.5% |
Graduates Information (2010)
Graduation Rate
School:
86.0%
District:
69.6%
State:
78.6%
Teacher Education Background (2009)
Percent With Master's Degree
School:
15.4%
District:
41.2%
Percent With Bachelor's Degree: 7.7%
Teacher Credentials & Experience (2009)
Percent of Teachers With Credentials: 93.5%
Number of Certificated Staff: 52.0
Average Number of Years of Teacher Experience: 10.7
Average Age
School:
46.6
District:
48.7
Source: CA Department of Education, Source: NCES 2009-2010
School Ratings and Reviews
Be The First To Review Excelsior Education Center School!
Sponsored Links
Test Scores and Performance Information
Overall School Rating
How is this determined?
The overall school rating shows that Excelsior Education Center School performed on average about the same as other schools across the state on CST state exams in the following subjects:
- CST Algebra I
- CST Algebra II
- CST Biology
- CST Chemistry
- CST Earth Science
- CST English-Language Arts
- CST Geometry
- CST History - Social Science
- CST Mathematics
- CST Physics
- CST Science
- CST Summative High School Math
- CST U.S. History
- CST World History
AYP Results (2010)
Overall AYP Met: No
ELA AYP Met: Yes
Math AYP Met: No
Program Improvement (PI) Requirement Under NCLB (2010)
First Year PI Requirement was Implemented: 2010-2011
School's Placement Under NCLB: Year 1
ACT Exam Results (2009)
Percent of Students Taking ACT Exam: 1.7%
SAT Exam Results (2009)
Percent of Students Taking SAT Exam: 9.0%
Average Combined Score: 1,450.0
Critical Reading Average: 494.3
Math Average: 483.8
Writing Average: 471.9
Percent Scoring At or Above 1500: 52.4%
CST - Test Proficiency by Grade and Subject
Grade 7 - % of students at or above proficiency
| School | District | State | |
|---|---|---|---|
| CST English-Language Arts Test | |||
| 2010 | 59.0% | 44.0% | 55.0% |
| 2009 | 62.0% | 42.0% | 54.0% |
| 2008 | 45.0% | 34.0% | 49.0% |
| CST Mathematics Test | |||
| 2010 | 38.0% | 45.0% | 48.0% |
| 2009 | 37.0% | 39.0% | 43.0% |
| 2008 | 22.0% | 32.0% | 41.0% |
Grade 8 - % of students at or above proficiency
| School | District | State | |
|---|---|---|---|
| CST Algebra I Test | |||
| 2010 | 16.0% | 33.0% | 46.0% |
| 2009 | 14.0% | 24.0% | 44.0% |
| 2008 | 10.0% | 44.0% | 42.0% |
| CST English-Language Arts Test | |||
| 2010 | 64.0% | 44.0% | 54.0% |
| 2009 | 59.0% | 36.0% | 48.0% |
| 2008 | 51.0% | 34.0% | 45.0% |
| CST History - Social Science Test | |||
| 2010 | 48.0% | 31.0% | 47.0% |
| 2009 | 42.0% | 25.0% | 42.0% |
| 2008 | 34.0% | 20.0% | 36.0% |
| CST Science Test | |||
| 2010 | 49.0% | 44.0% | 59.0% |
| 2009 | 36.0% | 42.0% | 56.0% |
| 2008 | 42.0% | 40.0% | 52.0% |
Grade 9 - % of students at or above proficiency
| School | District | State | |
|---|---|---|---|
| CST Algebra I Test | |||
| 2010 | 18.0% | 15.0% | 22.0% |
| 2009 | 19.0% | 10.0% | 21.0% |
| 2008 | 14.0% | 12.0% | 18.0% |
| CST Biology Test | |||
| 2010 | 19.0% | 42.0% | 55.0% |
| 2009 | 34.0% | 42.0% | 51.0% |
| 2008 | 24.0% | 41.0% | 52.0% |
| CST Earth Science Test | |||
| 2010 | 35.0% | 12.0% | 35.0% |
| 2009 | 39.0% | 6.0% | 29.0% |
| 2008 | 33.0% | 11.0% | 31.0% |
| CST English-Language Arts Test | |||
| 2010 | 57.0% | 43.0% | 54.0% |
| 2009 | 63.0% | 38.0% | 50.0% |
| 2008 | 51.0% | 35.0% | 49.0% |
| CST Geometry Test | |||
| 2010 | 50.0% | 25.0% | 46.0% |
| 2009 | 48.0% | 26.0% | 47.0% |
| 2008 | 16.0% | 17.0% | 43.0% |
| CST Algebra II Test | |||
| 2008 | 55.0% | 34.0% | 66.0% |
Grade 10 - % of students at or above proficiency
| School | District | State | |
|---|---|---|---|
| CST Algebra I Test | |||
| 2010 | 10.0% | 11.0% | 12.0% |
| 2009 | 16.0% | 4.0% | 11.0% |
| 2008 | 12.0% | 5.0% | 9.0% |
| CST Algebra II Test | |||
| 2010 | 22.0% | 24.0% | 40.0% |
| 2009 | 28.0% | 12.0% | 37.0% |
| 2008 | 33.0% | 13.0% | 36.0% |
| CST Biology Test | |||
| 2010 | 27.0% | 21.0% | 38.0% |
| 2009 | 26.0% | 17.0% | 34.0% |
| 2008 | 20.0% | 32.0% | 35.0% |
| CST Earth Science Test | |||
| 2010 | 36.0% | 20.0% | 29.0% |
| 2009 | 34.0% | 11.0% | 23.0% |
| 2008 | 37.0% | 16.0% | 23.0% |
| CST English-Language Arts Test | |||
| 2010 | 45.0% | 36.0% | 45.0% |
| 2009 | 49.0% | 31.0% | 44.0% |
| 2008 | 43.0% | 34.0% | 41.0% |
| CST Geometry Test | |||
| 2010 | 25.0% | 15.0% | 14.0% |
| 2009 | 28.0% | 10.0% | 14.0% |
| 2008 | 21.0% | 13.0% | 12.0% |
| CST Science Test | |||
| 2010 | 35.0% | 32.0% | 46.0% |
| 2009 | 36.0% | 29.0% | 44.0% |
| 2008 | 27.0% | 28.0% | 40.0% |
| CST World History Test | |||
| 2010 | 22.0% | 24.0% | 42.0% |
| 2009 | 24.0% | 22.0% | 38.0% |
| 2008 | 20.0% | 20.0% | 33.0% |
| CST Chemistry Test | |||
| 2008 | 33.0% | 17.0% | 41.0% |
Grade 11 - % of students at or above proficiency
| School | District | State | |
|---|---|---|---|
| CST Algebra I Test | |||
| 2010 | 15.0% | 5.0% | 8.0% |
| 2009 | 16.0% | 5.0% | 8.0% |
| 2008 | 13.0% | 10.0% | 5.0% |
| CST Algebra II Test | |||
| 2010 | 7.0% | 7.0% | 14.0% |
| 2009 | 17.0% | 5.0% | 12.0% |
| 2008 | 6.0% | 5.0% | 11.0% |
| CST Biology Test | |||
| 2010 | 28.0% | 47.0% | 46.0% |
| 2009 | - | - | - |
| 2008 | 11.0% | 32.0% | 39.0% |
| CST Chemistry Test | |||
| 2010 | 16.0% | 13.0% | 30.0% |
| 2009 | 22.0% | 9.0% | 27.0% |
| 2008 | 36.0% | 6.0% | 25.0% |
| CST Earth Science Test | |||
| 2010 | 34.0% | 17.0% | 32.0% |
| 2009 | 26.0% | 10.0% | 26.0% |
| 2008 | 41.0% | 12.0% | 28.0% |
| CST English-Language Arts Test | |||
| 2010 | 50.0% | 32.0% | 42.0% |
| 2009 | 41.0% | 30.0% | 40.0% |
| 2008 | 42.0% | 30.0% | 37.0% |
| CST Geometry Test | |||
| 2010 | 3.0% | 12.0% | 6.0% |
| 2009 | 11.0% | 7.0% | 7.0% |
| 2008 | 4.0% | 8.0% | 6.0% |
| CST Physics Test | |||
| 2010 | 19.0% | 45.0% | 53.0% |
| 2009 | 12.0% | 38.0% | 50.0% |
| 2008 | 21.0% | 49.0% | 47.0% |
| CST Summative High School Math Test | |||
| 2010 | 19.0% | 31.0% | 50.0% |
| 2009 | 26.0% | 27.0% | 47.0% |
| 2008 | 27.0% | 20.0% | 43.0% |
| CST U.S. History Test | |||
| 2010 | 34.0% | 33.0% | 45.0% |
| 2009 | 31.0% | 31.0% | 44.0% |
| 2008 | 36.0% | 30.0% | 38.0% |
End of Course - % of students at or above proficiency
| School | District | State | |
|---|---|---|---|
| CST Algebra I Test | |||
| 2010 | 15.0% | 20.0% | 31.0% |
| 2009 | 16.0% | 13.0% | 28.0% |
| 2008 | 12.0% | 18.0% | 25.0% |
| CST Algebra II Test | |||
| 2010 | 13.0% | 19.0% | 31.0% |
| 2009 | 24.0% | 14.0% | 28.0% |
| 2008 | 25.0% | 15.0% | 27.0% |
| CST Biology Test | |||
| 2010 | 27.0% | 38.0% | 46.0% |
| 2009 | 26.0% | 37.0% | 42.0% |
| 2008 | 20.0% | 38.0% | 42.0% |
| CST Chemistry Test | |||
| 2010 | 19.0% | 22.0% | 38.0% |
| 2009 | 22.0% | 16.0% | 36.0% |
| 2008 | 35.0% | 15.0% | 32.0% |
| CST Earth Science Test | |||
| 2010 | 35.0% | 14.0% | 33.0% |
| 2009 | 34.0% | 8.0% | 28.0% |
| 2008 | 35.0% | 13.0% | 28.0% |
| CST Geometry Test | |||
| 2010 | 19.0% | 20.0% | 27.0% |
| 2009 | 24.0% | 14.0% | 26.0% |
| 2008 | 11.0% | 13.0% | 24.0% |
| CST Physics Test | |||
| 2010 | 21.0% | 43.0% | 49.0% |
| 2009 | 13.0% | 33.0% | 46.0% |
| 2008 | 19.0% | 50.0% | 43.0% |
| CST Summative High School Math Test | |||
| 2010 | 18.0% | 35.0% | 54.0% |
| 2009 | 24.0% | 30.0% | 50.0% |
| 2008 | 31.0% | 23.0% | 47.0% |
| CST World History Test | |||
| 2010 | 22.0% | 22.0% | 41.0% |
| 2009 | 24.0% | 21.0% | 38.0% |
| 2008 | 21.0% | 18.0% | 33.0% |
Source: CA Department of Education 2009-2010
School Map and Similar Schools Nearby
Click to Activate Map of Nearby School Campuses
Private
Public
This School
Similar Schools Nearby
| Crosswalk: Hesperia Experiential Learning Pathways School 9-12 | 88 Students | 0.3 miles away | ![]() 5 out of 5 | |
| Alta Vista Public School KG-12 | 171 Students | 1.5 miles away | Not Yet Rated | - |
| Encore High School for the Performing and Visual Arts 7-12 | 620 Students | 2.6 miles away | ![]() 5 out of 5 | - |
| Options for Youth-Victorville Charter School 7-12 | 2,018 Students | 4.0 miles away | Not Yet Rated | |
| Academy for Academic Excellence KG-12 | 1,335 Students | 4.3 miles away | Not Yet Rated | |
| High Desert Academy of Applied Arts and Sciences 7-12 | 102 Students | 4.9 miles away | Not Yet Rated | |
| Mirus Secondary School 7-12 | 172 Students | 6.1 miles away | Not Yet Rated | - |
| Summit Leadership Academy-High Desert 9-12 | 189 Students | 7.8 miles away | ![]() 5 out of 5 | |
| Riverside Preparatory School KG-12 | 1,035 Students | 9.4 miles away | ![]() 5 out of 5 | - |
| Academy of Careers & Exploration KG-12 | 121 Students | 18.8 miles away | Not Yet Rated | - |
Compare This School To Nearby Schools ->
School Community Forum

Join a discussion about Excelsior Education Center School and talk to others in the community including students, parents, teachers, and administrators.
Popular Discussion Topics
- Admissions and Registration Questions (e.g. Dress Code and Discipline Policy)
- School Calendar and Upcoming Events (e.g. Graduation)
- After School Programs, Extracurricular Activities, and Athletics (e.g. Football)
- News and Announcements (e.g. Yearbook and Class Supply List Details)
- Graduate and Alumni Events (e.g. Organizing Class Reunions)
Navigation
Can't Find What You Are Looking For?
Rankings
Nearby Cities
Sponsored Links
K-12 Articles
Simple Math ... a Simple Gift
Math affects every aspect of our lives-from balancing the checkbook to estimating the amount of...
Information on Cyberbullying
What is Cyberbullying? Cyberbullying is a new form of harassment, emotional abuse,...
Teachers Packing Heat
After the recent school shootings (and thwarted school shootings) in the past month-just as after...

