Victor Valley High School

5 out of 5 | 1 Review
Find Old Friends From Victor Valley High School
Use the form below to search for alumni from Victor Valley High School.
School Description
School Summary and Highlights
- Enrolls 2,621 high school students from grades 9-12
- Ranks 710th out of 1,197 high schools in CA.
- 2010 Overall School AYP Met Status: No
Additional Contact Information
- Mailing Address: 16500 Mojave Dr., Victorville, CA 92395
School Operational Details
- Title I Eligible
School District Details
- Victor Valley Union High School District
- Per-Pupil Spending: $6,495
- Graduation Rate: 68.1%
- Dropout Rate: 11.4%
- Students Per Teacher: 23.2
- Enrolled Students: 13,993
Faculty Details and Student Enrollment
Students and Faculty
- Total Students Enrolled: 2,621
- Total Full Time "Equivalent" Teachers: 111.6
- Average Student-To-Teacher Ratio: 23.5
Students Gender Breakdown
- Males: 1,402 (53.5%)
- Females: 1,219 (46.5%)
Free Lunch Student Eligibility Breakdown
- Eligible for Reduced Lunch: 312 (11.9%)
- Eligible for Free Lunch: 1,663 (63.4%)
- Eligible for Either Reduced or Free Lunch: 1,975 (75.4%)
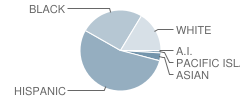
Student Enrollment Distribution by Race / Ethnicity

| Number | Percent | |
|---|---|---|
| American Indian | 6 | 0.2% |
| Black | 665 | 25.4% |
| Asian | 83 | 3.2% |
| Hispanic | 1,413 | 53.9% |
| White | 428 | 16.3% |
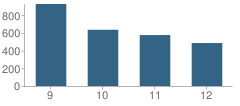
Number of Students Per Grade

| Number | Percent | |
|---|---|---|
| 9th Grade | 926 | 35.3% |
| 10th Grade | 635 | 24.2% |
| 11th Grade | 575 | 21.9% |
| 12th Grade | 485 | 18.5% |
Graduates Information (2010)
Graduation Rate
School:
81.6%
District:
69.6%
State:
78.6%
Teacher Education Background (2009)
Percent With Ph.D.
School:
84.7%
District:
11.8%
Percent With Master's Degree
School:
26.3%
District:
41.2%
Percent With Bachelor's Degree: 10.2%
Teacher Credentials & Experience (2009)
Percent of Teachers With Emergency Credentials: 4.8%
Percent of Teachers With Credentials: 83.8%
Number of Certificated Staff: 118.0
Average Number of Years of Teacher Experience: 12.5
Average Age
School:
43.6
District:
48.7
Source: CA Department of Education, Source: NCES 2009-2010
Sponsored Links
Test Scores and Performance Information
Overall School Rating
How is this determined?
The overall school rating shows that Victor Valley High School performed on average about the same as other schools across the state on CST state exams in the following subjects:
- CST Algebra I
- CST Algebra II
- CST Biology
- CST Chemistry
- CST Earth Science
- CST English-Language Arts
- CST Geometry
- CST Integrated Math 1
- CST Integrated/Coordinated Science
- CST Physics
- CST Science
- CST Summative High School Math
- CST U.S. History
- CST World History
AYP Results (2010)
Overall AYP Met: No
ELA AYP Met: No
Math AYP Met: No
Program Improvement (PI) Requirement Under NCLB (2010)
First Year PI Requirement was Implemented: 2010-2011
School's Placement Under NCLB: Year 1
ACT Exam Results (2009)
Percent of Students Taking ACT Exam: 6.7%
Average Combined Score: 20.8
Percent Scoring At or Above 21: 50.0%
SAT Exam Results (2009)
Percent of Students Taking SAT Exam: 23.8%
Average Combined Score: 1,353.6
Critical Reading Average: 452.3
Math Average: 447.8
Writing Average: 453.4
Percent Scoring At or Above 1500: 23.3%
CST - Test Proficiency by Grade and Subject
Grade 9 - % of students at or above proficiency
| School | District | State | |
|---|---|---|---|
| CST Algebra I Test | |||
| 2010 | 23.0% | 15.0% | 22.0% |
| 2009 | 14.0% | 10.0% | 21.0% |
| 2008 | 19.0% | 12.0% | 18.0% |
| CST Algebra II Test | |||
| 2010 | 28.0% | 35.0% | 69.0% |
| 2009 | 31.0% | 35.0% | 65.0% |
| 2008 | 38.0% | 34.0% | 66.0% |
| CST Biology Test | |||
| 2010 | 31.0% | 42.0% | 55.0% |
| 2009 | 28.0% | 42.0% | 51.0% |
| 2008 | 31.0% | 41.0% | 52.0% |
| CST Earth Science Test | |||
| 2010 | 16.0% | 12.0% | 35.0% |
| 2009 | 8.0% | 6.0% | 29.0% |
| 2008 | 12.0% | 11.0% | 31.0% |
| CST English-Language Arts Test | |||
| 2010 | 40.0% | 43.0% | 54.0% |
| 2009 | 36.0% | 38.0% | 50.0% |
| 2008 | 36.0% | 35.0% | 49.0% |
| CST World History Test | |||
| 2010 | 6.0% | 12.0% | 45.0% |
| 2009 | 4.0% | 17.0% | 41.0% |
| 2008 | 7.0% | 5.0% | 36.0% |
Grade 10 - % of students at or above proficiency
| School | District | State | |
|---|---|---|---|
| CST Algebra I Test | |||
| 2010 | 21.0% | 11.0% | 12.0% |
| 2009 | 9.0% | 4.0% | 11.0% |
| 2008 | 5.0% | 5.0% | 9.0% |
| CST Algebra II Test | |||
| 2010 | 9.0% | 24.0% | 40.0% |
| 2009 | 5.0% | 12.0% | 37.0% |
| 2008 | 5.0% | 13.0% | 36.0% |
| CST Biology Test | |||
| 2010 | 25.0% | 21.0% | 38.0% |
| 2009 | 18.0% | 17.0% | 34.0% |
| 2008 | 39.0% | 32.0% | 35.0% |
| CST Chemistry Test | |||
| 2010 | 32.0% | 26.0% | 47.0% |
| 2009 | 20.0% | 18.0% | 44.0% |
| 2008 | 19.0% | 17.0% | 41.0% |
| CST Earth Science Test | |||
| 2010 | 34.0% | 20.0% | 29.0% |
| 2009 | 16.0% | 11.0% | 23.0% |
| 2008 | 15.0% | 16.0% | 23.0% |
| CST English-Language Arts Test | |||
| 2010 | 41.0% | 36.0% | 45.0% |
| 2009 | 38.0% | 31.0% | 44.0% |
| 2008 | 37.0% | 34.0% | 41.0% |
| CST Geometry Test | |||
| 2010 | 39.0% | 15.0% | 14.0% |
| 2009 | 36.0% | 10.0% | 14.0% |
| 2008 | 31.0% | 13.0% | 12.0% |
| CST Integrated/Coordinated Science Test | |||
| 2010 | 26.0% | 26.0% | 14.0% |
| 2009 | 33.0% | 33.0% | 9.0% |
| CST Science Test | |||
| 2010 | 36.0% | 32.0% | 46.0% |
| 2009 | 33.0% | 29.0% | 44.0% |
| 2008 | 31.0% | 28.0% | 40.0% |
| CST World History Test | |||
| 2010 | 30.0% | 24.0% | 42.0% |
| 2009 | 24.0% | 22.0% | 38.0% |
| 2008 | 25.0% | 20.0% | 33.0% |
Grade 11 - % of students at or above proficiency
| School | District | State | |
|---|---|---|---|
| CST Algebra I Test | |||
| 2010 | 3.0% | 5.0% | 8.0% |
| 2009 | 9.0% | 5.0% | 8.0% |
| 2008 | 8.0% | 10.0% | 5.0% |
| CST Algebra II Test | |||
| 2010 | 6.0% | 7.0% | 14.0% |
| 2009 | 4.0% | 5.0% | 12.0% |
| 2008 | 3.0% | 5.0% | 11.0% |
| CST Biology Test | |||
| 2010 | 37.0% | 47.0% | 46.0% |
| 2009 | 41.0% | 46.0% | 41.0% |
| 2008 | 28.0% | 32.0% | 39.0% |
| CST Chemistry Test | |||
| 2010 | 28.0% | 13.0% | 30.0% |
| 2009 | 17.0% | 9.0% | 27.0% |
| 2008 | 5.0% | 6.0% | 25.0% |
| CST Earth Science Test | |||
| 2010 | 32.0% | 17.0% | 32.0% |
| 2009 | 16.0% | 10.0% | 26.0% |
| 2008 | 21.0% | 12.0% | 28.0% |
| CST English-Language Arts Test | |||
| 2010 | 38.0% | 32.0% | 42.0% |
| 2009 | 38.0% | 30.0% | 40.0% |
| 2008 | 34.0% | 30.0% | 37.0% |
| CST Geometry Test | |||
| 2010 | 27.0% | 12.0% | 6.0% |
| 2009 | 17.0% | 7.0% | 7.0% |
| 2008 | 10.0% | 8.0% | 6.0% |
| CST Integrated Math 1 Test | |||
| 2010 | 19.0% | 13.0% | 11.0% |
| 2009 | 11.0% | 11.0% | 9.0% |
| CST Integrated/Coordinated Science Test | |||
| 2010 | 31.0% | 31.0% | 8.0% |
| 2009 | 23.0% | 23.0% | 11.0% |
| CST Physics Test | |||
| 2010 | 51.0% | 45.0% | 53.0% |
| 2009 | 44.0% | 38.0% | 50.0% |
| 2008 | 46.0% | 49.0% | 47.0% |
| CST Summative High School Math Test | |||
| 2010 | 35.0% | 31.0% | 50.0% |
| 2009 | 26.0% | 27.0% | 47.0% |
| 2008 | 13.0% | 20.0% | 43.0% |
| CST U.S. History Test | |||
| 2010 | 45.0% | 33.0% | 45.0% |
| 2009 | 41.0% | 31.0% | 44.0% |
| 2008 | 33.0% | 30.0% | 38.0% |
| CST World History Test | |||
| 2010 | 37.0% | 12.0% | 15.0% |
| 2009 | 14.0% | 8.0% | 11.0% |
| 2008 | 16.0% | 7.0% | 9.0% |
End of Course - % of students at or above proficiency
| School | District | State | |
|---|---|---|---|
| CST Algebra I Test | |||
| 2010 | 21.0% | 20.0% | 31.0% |
| 2009 | 12.0% | 13.0% | 28.0% |
| 2008 | 15.0% | 18.0% | 25.0% |
| CST Algebra II Test | |||
| 2010 | 14.0% | 19.0% | 31.0% |
| 2009 | 11.0% | 14.0% | 28.0% |
| 2008 | 12.0% | 15.0% | 27.0% |
| CST Biology Test | |||
| 2010 | 30.0% | 38.0% | 46.0% |
| 2009 | 26.0% | 37.0% | 42.0% |
| 2008 | 33.0% | 38.0% | 42.0% |
| CST Chemistry Test | |||
| 2010 | 31.0% | 22.0% | 38.0% |
| 2009 | 19.0% | 16.0% | 36.0% |
| 2008 | 14.0% | 15.0% | 32.0% |
| CST Earth Science Test | |||
| 2010 | 20.0% | 14.0% | 33.0% |
| 2009 | 11.0% | 8.0% | 28.0% |
| 2008 | 14.0% | 13.0% | 28.0% |
| CST Geometry Test | |||
| 2010 | 32.0% | 20.0% | 27.0% |
| 2009 | 25.0% | 14.0% | 26.0% |
| 2008 | 16.0% | 13.0% | 24.0% |
| CST Integrated Math 1 Test | |||
| 2010 | 19.0% | 11.0% | 13.0% |
| 2009 | 11.0% | 11.0% | 11.0% |
| CST Integrated/Coordinated Science Test | |||
| 2010 | 27.0% | 27.0% | 16.0% |
| 2009 | 29.0% | 29.0% | 13.0% |
| CST Physics Test | |||
| 2010 | 50.0% | 43.0% | 49.0% |
| 2009 | 40.0% | 33.0% | 46.0% |
| 2008 | 47.0% | 50.0% | 43.0% |
| CST Summative High School Math Test | |||
| 2010 | 37.0% | 35.0% | 54.0% |
| 2009 | 29.0% | 30.0% | 50.0% |
| 2008 | 13.0% | 23.0% | 47.0% |
| CST World History Test | |||
| 2010 | 29.0% | 22.0% | 41.0% |
| 2009 | 23.0% | 21.0% | 38.0% |
| 2008 | 22.0% | 18.0% | 33.0% |
Source: CA Department of Education 2009-2010
School Map and Similar Schools Nearby
Click to Activate Map of Nearby School Campuses
Private
Public
This School
Similar Schools Nearby
| Imogene Garner Hook Junior High School 7-8 | 904 Students | 1.9 miles away | ![]() 5 out of 5 | |
| Silverado High School 9-12 | 3,753 Students | 4.3 miles away | ![]() 3.5 out of 5 | |
| Hesperia Junior High School 7-8 | 1,137 Students | 6.5 miles away | Not Yet Rated | |
| Hesperia High School 9-12 | 2,293 Students | 7.2 miles away | ![]() 5 out of 5 | |
| Apple Valley High School 9-12 | 2,145 Students | 7.7 miles away | ![]() 5 out of 5 | |
| Granite Hills High School 9-12 | 2,013 Students | 8.1 miles away | ![]() 5 out of 5 | |
| Sultana High School 9-12 | 2,386 Students | 8.2 miles away | ![]() 3.5 out of 5 | |
| Rim of the World High School 9-12 | 1,402 Students | 21.3 miles away | ![]() 3.5 out of 5 | |
| Lucerne Valley High School 9-12 | 311 Students | 21.4 miles away | ![]() 1 out of 5 | |
| Cajon High School 9-12 | 2,913 Students | 24.5 miles away | ![]() 4.5 out of 5 | |
Compare This School To Nearby Schools ->
School Community Forum

Join a discussion about Victor Valley High School and talk to others in the community including students, parents, teachers, and administrators.
Popular Discussion Topics
- Admissions and Registration Questions (e.g. Dress Code and Discipline Policy)
- School Calendar and Upcoming Events (e.g. Graduation)
- After School Programs, Extracurricular Activities, and Athletics (e.g. Football)
- News and Announcements (e.g. Yearbook and Class Supply List Details)
- Graduate and Alumni Events (e.g. Organizing Class Reunions)
Navigation
Can't Find What You Are Looking For?
Rankings
Nearby Cities
Sponsored Links
K-12 Articles
Teach Your Child to Write Well
When American children head off to junior kindergarten, they must be ready to learn. It is your...
Grammar...not Just Extended Family Anymore!
Can I talk to y'all abit about grammar? Right grammar and punctuations got to be some of the...
Bullycide: What is It and How Can It Be Prevented?
Disclaimer: This article expresses my opinion that has been formed by personal experience and...


(5 / 5) 


