Sonoma Valley High School

No Reviews Yet
Find Old Friends From Sonoma Valley High School
Use the form below to search for alumni from Sonoma Valley High School.
School Description
School Summary and Highlights
- Enrolls 1,314 high school students from grades 9-12
- Ranks 620th out of 1,197 high schools in CA.
- 2010 Overall School AYP Met Status: No
School District Details
- Sonoma Valley Unified School District
- Per-Pupil Spending: $8,772
- Graduation Rate: 74.9%
- Dropout Rate: 2.7%
- Students Per Teacher: 19.3
- Enrolled Students: 4,665
Faculty Details and Student Enrollment
Students and Faculty
- Total Students Enrolled: 1,314
- Total Full Time "Equivalent" Teachers: 63.1
- Average Student-To-Teacher Ratio: 20.8
Students Gender Breakdown
- Males: 688 (52.4%)
- Females: 626 (47.6%)
Free Lunch Student Eligibility Breakdown
- Eligible for Reduced Lunch: 79 (6.0%)
- Eligible for Free Lunch: 455 (34.6%)
- Eligible for Either Reduced or Free Lunch: 534 (40.6%)
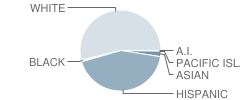
Student Enrollment Distribution by Race / Ethnicity

| Number | Percent | |
|---|---|---|
| American Indian | 3 | 0.2% |
| Black | 8 | 0.6% |
| Asian | 29 | 2.2% |
| Hispanic | 563 | 42.8% |
| White | 704 | 53.6% |
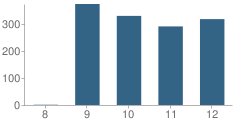
Number of Students Per Grade

| Number | Percent | |
|---|---|---|
| 8th Grade | 1 | 0.08% |
| 9th Grade | 374 | 28.5% |
| 10th Grade | 330 | 25.1% |
| 11th Grade | 291 | 22.1% |
| 12th Grade | 318 | 24.2% |
Graduates Information (2010)
Graduation Rate
School:
92.6%
District:
91.3%
State:
78.6%
Teacher Education Background (2009)
Percent With Master's Degree
School:
16.9%
District:
50.0%
Percent With Bachelor's Degree: 7.8%
Teacher Credentials & Experience (2009)
Percent of Teachers With Credentials: 100.0%
Number of Certificated Staff: 77.0
Average Number of Years of Teacher Experience: 18.1
Average Age
School:
48.9
District:
47.7
Source: CA Department of Education, Source: NCES 2009-2010
School Ratings and Reviews
Be The First To Review Sonoma Valley High School!
Sponsored Links
Test Scores and Performance Information
Overall School Rating
How is this determined?
The overall school rating shows that Sonoma Valley High School performed on average about the same as other schools across the state on CST state exams in the following subjects:
- CST Algebra I
- CST Algebra II
- CST Biology
- CST Chemistry
- CST Earth Science
- CST English-Language Arts
- CST General Mathematics
- CST Geometry
- CST Science
- CST Summative High School Math
- CST U.S. History
- CST World History
AYP Results (2010)
Overall AYP Met: No
ELA AYP Met: No
Math AYP Met: No
ACT Exam Results (2009)
Percent of Students Taking ACT Exam: 21.9%
Average Combined Score: 24.1
Percent Scoring At or Above 21: 72.6%
SAT Exam Results (2009)
Percent of Students Taking SAT Exam: 42.2%
Average Combined Score: 1,577.2
Critical Reading Average: 526.3
Math Average: 531.4
Writing Average: 519.5
Percent Scoring At or Above 1500: 63.1%
CST - Test Proficiency by Grade and Subject
Grade 9 - % of students at or above proficiency
| School | District | State | |
|---|---|---|---|
| CST Algebra I Test | |||
| 2010 | 18.0% | 18.0% | 22.0% |
| 2009 | 15.0% | 15.0% | 21.0% |
| 2008 | 17.0% | 17.0% | 18.0% |
| CST Algebra II Test | |||
| 2010 | 61.0% | 61.0% | 69.0% |
| 2009 | - | - | - |
| 2008 | 75.0% | 75.0% | 66.0% |
| CST Biology Test | |||
| 2010 | 77.0% | 72.0% | 55.0% |
| 2009 | 40.0% | 40.0% | 51.0% |
| 2008 | 34.0% | 32.0% | 52.0% |
| CST Earth Science Test | |||
| 2010 | 45.0% | 45.0% | 35.0% |
| 2009 | 39.0% | 39.0% | 29.0% |
| 2008 | 45.0% | 45.0% | 31.0% |
| CST English-Language Arts Test | |||
| 2010 | 58.0% | 57.0% | 54.0% |
| 2009 | 47.0% | 47.0% | 50.0% |
| 2008 | 58.0% | 56.0% | 49.0% |
| CST General Mathematics Test | |||
| 2010 | 15.0% | 15.0% | 17.0% |
| 2009 | 8.0% | 7.0% | 17.0% |
| CST Geometry Test | |||
| 2010 | 43.0% | 43.0% | 46.0% |
| 2009 | 62.0% | 62.0% | 47.0% |
| 2008 | 61.0% | 61.0% | 43.0% |
| CST World History Test | |||
| 2010 | 15.0% | 11.0% | 45.0% |
| 2009 | 20.0% | 16.0% | 41.0% |
| 2008 | 9.0% | 8.0% | 36.0% |
Grade 10 - % of students at or above proficiency
| School | District | State | |
|---|---|---|---|
| CST Algebra I Test | |||
| 2010 | 6.0% | 7.0% | 12.0% |
| 2009 | 6.0% | 6.0% | 11.0% |
| 2008 | 5.0% | 5.0% | 9.0% |
| CST Algebra II Test | |||
| 2010 | 31.0% | 31.0% | 40.0% |
| 2009 | 29.0% | 29.0% | 37.0% |
| 2008 | 53.0% | 53.0% | 36.0% |
| CST Biology Test | |||
| 2010 | 42.0% | 42.0% | 38.0% |
| 2009 | 51.0% | 50.0% | 34.0% |
| 2008 | 46.0% | 46.0% | 35.0% |
| CST Earth Science Test | |||
| 2010 | 11.0% | 8.0% | 29.0% |
| 2009 | - | - | - |
| 2008 | 10.0% | 10.0% | 23.0% |
| CST English-Language Arts Test | |||
| 2010 | 41.0% | 40.0% | 45.0% |
| 2009 | 48.0% | 45.0% | 44.0% |
| 2008 | 46.0% | 44.0% | 41.0% |
| CST Geometry Test | |||
| 2010 | 10.0% | 10.0% | 14.0% |
| 2009 | 14.0% | 14.0% | 14.0% |
| 2008 | 22.0% | 22.0% | 12.0% |
| CST Science Test | |||
| 2010 | 45.0% | 45.0% | 46.0% |
| 2009 | 59.0% | 59.0% | 44.0% |
| 2008 | 49.0% | 49.0% | 40.0% |
| CST World History Test | |||
| 2010 | 33.0% | 32.0% | 42.0% |
| 2009 | 43.0% | 42.0% | 38.0% |
| 2008 | 31.0% | 30.0% | 33.0% |
| CST Summative High School Math Test | |||
| 2009 | 54.0% | 54.0% | 71.0% |
Grade 11 - % of students at or above proficiency
| School | District | State | |
|---|---|---|---|
| CST Algebra I Test | |||
| 2010 | 7.0% | 6.0% | 8.0% |
| 2009 | 5.0% | 4.0% | 8.0% |
| 2008 | 9.0% | 9.0% | 5.0% |
| CST Algebra II Test | |||
| 2010 | 15.0% | 15.0% | 14.0% |
| 2009 | 14.0% | 14.0% | 12.0% |
| 2008 | 13.0% | 13.0% | 11.0% |
| CST Biology Test | |||
| 2010 | 39.0% | 39.0% | 46.0% |
| 2009 | 49.0% | 49.0% | 41.0% |
| 2008 | 48.0% | 47.0% | 39.0% |
| CST Chemistry Test | |||
| 2010 | 39.0% | 39.0% | 30.0% |
| 2009 | 51.0% | 51.0% | 27.0% |
| 2008 | 46.0% | 46.0% | 25.0% |
| CST Earth Science Test | |||
| 2010 | 18.0% | 18.0% | 32.0% |
| 2009 | 28.0% | 28.0% | 26.0% |
| 2008 | 6.0% | 6.0% | 28.0% |
| CST English-Language Arts Test | |||
| 2010 | 45.0% | 42.0% | 42.0% |
| 2009 | 48.0% | 46.0% | 40.0% |
| 2008 | 46.0% | 44.0% | 37.0% |
| CST Geometry Test | |||
| 2010 | 4.0% | 4.0% | 6.0% |
| 2009 | 3.0% | 3.0% | 7.0% |
| 2008 | 6.0% | 6.0% | 6.0% |
| CST Summative High School Math Test | |||
| 2010 | 49.0% | 49.0% | 50.0% |
| 2009 | 45.0% | 45.0% | 47.0% |
| 2008 | 60.0% | 60.0% | 43.0% |
| CST U.S. History Test | |||
| 2010 | 37.0% | 37.0% | 45.0% |
| 2009 | 44.0% | 44.0% | 44.0% |
| 2008 | 43.0% | 43.0% | 38.0% |
| CST World History Test | |||
| 2008 | 25.0% | 26.0% | 9.0% |
End of Course - % of students at or above proficiency
| School | District | State | |
|---|---|---|---|
| CST Algebra I Test | |||
| 2010 | 13.0% | 28.0% | 31.0% |
| 2009 | 12.0% | 24.0% | 28.0% |
| 2008 | 12.0% | 26.0% | 25.0% |
| CST Algebra II Test | |||
| 2010 | 29.0% | 29.0% | 31.0% |
| 2009 | 23.0% | 23.0% | 28.0% |
| 2008 | 34.0% | 34.0% | 27.0% |
| CST Biology Test | |||
| 2010 | 45.0% | 44.0% | 46.0% |
| 2009 | 50.0% | 50.0% | 42.0% |
| 2008 | 46.0% | 45.0% | 42.0% |
| CST Chemistry Test | |||
| 2010 | 42.0% | 42.0% | 38.0% |
| 2009 | 53.0% | 53.0% | 36.0% |
| 2008 | 46.0% | 46.0% | 32.0% |
| CST Earth Science Test | |||
| 2010 | 43.0% | 41.0% | 33.0% |
| 2009 | 38.0% | 38.0% | 28.0% |
| 2008 | 42.0% | 41.0% | 28.0% |
| CST General Mathematics Test | |||
| 2010 | 15.0% | 33.0% | 27.0% |
| 2009 | 8.0% | 30.0% | 26.0% |
| CST Geometry Test | |||
| 2010 | 18.0% | 22.0% | 27.0% |
| 2009 | 31.0% | 37.0% | 26.0% |
| 2008 | 32.0% | 33.0% | 24.0% |
| CST Summative High School Math Test | |||
| 2010 | 52.0% | 52.0% | 54.0% |
| 2009 | 47.0% | 47.0% | 50.0% |
| 2008 | 63.0% | 63.0% | 47.0% |
| CST World History Test | |||
| 2010 | 31.0% | 30.0% | 41.0% |
| 2009 | 40.0% | 39.0% | 38.0% |
| 2008 | 30.0% | 29.0% | 33.0% |
Source: CA Department of Education 2009-2010
School Map and Similar Schools Nearby
Click to Activate Map of Nearby School Campuses
Private
Public
This School
Similar Schools Nearby
| Montgomery High School 9-12 | 1,755 Students | 16.3 miles away | Not Yet Rated | |
| Elsie Allen High School 9-12 | 1,151 Students | 17.1 miles away | ![]() 5 out of 5 | |
| Maria Carrillo High School 9-12 | 1,574 Students | 17.4 miles away | ![]() 4.5 out of 5 | |
| Santa Rosa High School 9-12 | 1,942 Students | 18.3 miles away | Not Yet Rated | |
| Piner High School 9-12 | 1,178 Students | 20.8 miles away | ![]() 1 out of 5 | |
| Analy High School 9-12 | 1,280 Students | 21.7 miles away | ![]() 5 out of 5 | |
| Vacaville High School 9-12 | 2,142 Students | 25.8 miles away | Not Yet Rated | |
| Windsor High School 9-12 | 1,673 Students | 26.4 miles away | Not Yet Rated | |
| Will C. Wood High School 9-12 | 1,852 Students | 26.7 miles away | ![]() 5 out of 5 | |
| El Molino High School 9-12 | 852 Students | 27.1 miles away | ![]() 4.5 out of 5 | |
Compare This School To Nearby Schools ->
School Community Forum

Join a discussion about Sonoma Valley High School and talk to others in the community including students, parents, teachers, and administrators.
Popular Discussion Topics
- Admissions and Registration Questions (e.g. Dress Code and Discipline Policy)
- School Calendar and Upcoming Events (e.g. Graduation)
- After School Programs, Extracurricular Activities, and Athletics (e.g. Football)
- News and Announcements (e.g. Yearbook and Class Supply List Details)
- Graduate and Alumni Events (e.g. Organizing Class Reunions)
Navigation
Can't Find What You Are Looking For?
Rankings
Nearby Cities
Sponsored Links
K-12 Articles
Middle School Homework and Study Habits
The report cards came home and you're disappointed with your child's scores. You know he has the...
Helping Young Children with Printing and Cursive Writing
Is your child experiencing difficulty printing or writing? Is he unable to print or write legibly,...
Cell Phones... the Best Thing Since Sliced Bread or the Worst Invention in the World?
Cell phones are wonderful, the best things humans have ever invented! They help us keep in touch...


