El Camino High School
1320 Mission Rd, South San Francisco, CA 94080 | (650) 877-8806
- Grades: 9-12
- Student Enrollment: 1,483

5 out of 5 | 1 Review
Find Old Friends From El Camino High School
Use the form below to search for alumni from El Camino High School.
School Description
School Summary and Highlights
- Enrolls 1,483 high school students from grades 9-12
- Ranks 216th out of 1,197 high schools in CA.
- 2010 Overall School AYP Met Status: No
Additional Contact Information
- Mailing Address: 398 B St., South San Francisco, CA 94080
School District Details
- South San Francisco Unified School District
- Per-Pupil Spending: $7,417
- Graduation Rate: 82.8%
- Dropout Rate: 2.2%
- Students Per Teacher: 21.1
- Enrolled Students: 9,319
Faculty Details and Student Enrollment
Students and Faculty
- Total Students Enrolled: 1,483
- Total Full Time "Equivalent" Teachers: 63.8
- Average Student-To-Teacher Ratio: 23.2
Students Gender Breakdown
- Males: 758 (51.1%)
- Females: 725 (48.9%)
Free Lunch Student Eligibility Breakdown
- Eligible for Reduced Lunch: 106 (7.1%)
- Eligible for Free Lunch: 209 (14.1%)
- Eligible for Either Reduced or Free Lunch: 315 (21.2%)
Student Enrollment Distribution by Race / Ethnicity
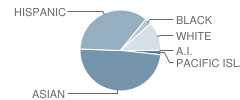
| Number | Percent | |
|---|---|---|
| American Indian | 1 | 0.07% |
| Black | 34 | 2.3% |
| Asian | 645 | 43.5% |
| Hispanic | 465 | 31.4% |
| White | 153 | 10.3% |
Number of Students Per Grade
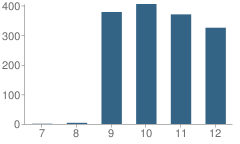
| Number | Percent | |
|---|---|---|
| 7th Grade | 1 | 0.07% |
| 8th Grade | 4 | 0.3% |
| 9th Grade | 378 | 25.5% |
| 10th Grade | 405 | 27.3% |
| 11th Grade | 370 | 24.9% |
| 12th Grade | 325 | 21.9% |
Graduates Information (2010)
Graduation Rate
School:
97.5%
District:
91.0%
State:
78.6%
Teacher Education Background (2009)
Percent With Ph.D.
School:
1.4%
District:
5.6%
Percent With Master's Degree
School:
13.7%
District:
11.1%
Percent With Bachelor's Degree: 24.7%
Teacher Credentials & Experience (2009)
Percent of Teachers With Emergency Credentials: 1.6%
Percent of Teachers With Credentials: 87.5%
Number of Certificated Staff: 73.0
Average Number of Years of Teacher Experience: 10.1
Average Age
School:
38.4
District:
46.0
Source: CA Department of Education, Source: NCES 2009-2010
Sponsored Links
Test Scores and Performance Information
Overall School Rating
How is this determined?
The overall school rating shows that El Camino High School performed on average better than many other schools across the state on CST state exams in the following subjects:
- CST Algebra I
- CST Algebra II
- CST Biology
- CST Chemistry
- CST English-Language Arts
- CST General Mathematics
- CST Geometry
- CST Integrated/Coordinated Science
- CST Physics
- CST Science
- CST Summative High School Math
- CST U.S. History
- CST World History
AYP Results (2010)
Overall AYP Met: No
ELA AYP Met: Yes
Math AYP Met: No
ACT Exam Results (2009)
Percent of Students Taking ACT Exam: 3.3%
Average Combined Score: 21.8
Percent Scoring At or Above 21: 58.3%
SAT Exam Results (2009)
Percent of Students Taking SAT Exam: 46.5%
Average Combined Score: 1,438.4
Critical Reading Average: 467.8
Math Average: 499.0
Writing Average: 471.6
Percent Scoring At or Above 1500: 41.3%
CST - Test Proficiency by Grade and Subject
Grade 9 - % of students at or above proficiency
| School | District | State | |
|---|---|---|---|
| CST Algebra I Test | |||
| 2010 | 50.0% | 35.0% | 22.0% |
| 2009 | 29.0% | 26.0% | 21.0% |
| 2008 | 36.0% | 36.0% | 18.0% |
| CST Biology Test | |||
| 2010 | 69.0% | 64.0% | 55.0% |
| 2009 | 57.0% | 59.0% | 51.0% |
| 2008 | 58.0% | 63.0% | 52.0% |
| CST English-Language Arts Test | |||
| 2010 | 69.0% | 65.0% | 54.0% |
| 2009 | 67.0% | 62.0% | 50.0% |
| 2008 | 56.0% | 55.0% | 49.0% |
| CST General Mathematics Test | |||
| 2010 | 38.0% | 37.0% | 17.0% |
| 2009 | 37.0% | 34.0% | 17.0% |
| 2008 | 44.0% | 42.0% | 18.0% |
| CST Geometry Test | |||
| 2010 | 63.0% | 61.0% | 46.0% |
| 2009 | 71.0% | 68.0% | 47.0% |
| 2008 | 64.0% | 61.0% | 43.0% |
| CST Integrated/Coordinated Science Test | |||
| 2010 | 8.0% | 7.0% | 19.0% |
| 2009 | 12.0% | 10.0% | 15.0% |
| 2008 | 6.0% | 8.0% | 5.0% |
Grade 10 - % of students at or above proficiency
| School | District | State | |
|---|---|---|---|
| CST Algebra I Test | |||
| 2010 | 41.0% | 27.0% | 12.0% |
| 2009 | 23.0% | 19.0% | 11.0% |
| 2008 | 9.0% | 10.0% | 9.0% |
| CST Algebra II Test | |||
| 2010 | 49.0% | 51.0% | 40.0% |
| 2009 | 53.0% | 43.0% | 37.0% |
| 2008 | 42.0% | 45.0% | 36.0% |
| CST Biology Test | |||
| 2010 | 43.0% | 39.0% | 38.0% |
| 2009 | 23.0% | 26.0% | 34.0% |
| 2008 | 18.0% | 22.0% | 35.0% |
| CST Chemistry Test | |||
| 2010 | 32.0% | 41.0% | 47.0% |
| 2009 | 47.0% | 45.0% | 44.0% |
| 2008 | 30.0% | 32.0% | 41.0% |
| CST English-Language Arts Test | |||
| 2010 | 57.0% | 54.0% | 45.0% |
| 2009 | 53.0% | 50.0% | 44.0% |
| 2008 | 37.0% | 36.0% | 41.0% |
| CST Geometry Test | |||
| 2010 | 28.0% | 25.0% | 14.0% |
| 2009 | 34.0% | 29.0% | 14.0% |
| 2008 | 24.0% | 26.0% | 12.0% |
| CST Integrated/Coordinated Science Test | |||
| 2010 | 15.0% | 22.0% | 14.0% |
| 2009 | 12.0% | 6.0% | 9.0% |
| 2008 | 5.0% | 7.0% | 7.0% |
| CST Science Test | |||
| 2010 | 61.0% | 61.0% | 46.0% |
| 2009 | 57.0% | 55.0% | 44.0% |
| 2008 | 38.0% | 40.0% | 40.0% |
| CST World History Test | |||
| 2010 | 55.0% | 54.0% | 42.0% |
| 2009 | 50.0% | 48.0% | 38.0% |
| 2008 | 34.0% | 41.0% | 33.0% |
Grade 11 - % of students at or above proficiency
| School | District | State | |
|---|---|---|---|
| CST Algebra I Test | |||
| 2010 | 33.0% | 14.0% | 8.0% |
| 2009 | 19.0% | 11.0% | 8.0% |
| CST Algebra II Test | |||
| 2010 | 11.0% | 13.0% | 14.0% |
| 2009 | 8.0% | 9.0% | 12.0% |
| 2008 | 15.0% | 15.0% | 11.0% |
| CST Biology Test | |||
| 2010 | 69.0% | 64.0% | 46.0% |
| 2009 | 58.0% | 58.0% | 41.0% |
| 2008 | 47.0% | 45.0% | 39.0% |
| CST Chemistry Test | |||
| 2010 | 6.0% | 19.0% | 30.0% |
| 2009 | 9.0% | 16.0% | 27.0% |
| 2008 | 9.0% | 10.0% | 25.0% |
| CST English-Language Arts Test | |||
| 2010 | 55.0% | 52.0% | 42.0% |
| 2009 | 42.0% | 40.0% | 40.0% |
| 2008 | 41.0% | 36.0% | 37.0% |
| CST Geometry Test | |||
| 2010 | 5.0% | 9.0% | 6.0% |
| 2009 | 5.0% | 9.0% | 7.0% |
| 2008 | 7.0% | 10.0% | 6.0% |
| CST Integrated/Coordinated Science Test | |||
| 2010 | 20.0% | 15.0% | 8.0% |
| 2009 | 14.0% | 11.0% | 11.0% |
| 2008 | 13.0% | 13.0% | 10.0% |
| CST Physics Test | |||
| 2010 | 81.0% | 81.0% | 53.0% |
| 2009 | 37.0% | 63.0% | 50.0% |
| 2008 | 35.0% | 56.0% | 47.0% |
| CST Summative High School Math Test | |||
| 2010 | 58.0% | 56.0% | 50.0% |
| 2009 | 46.0% | 46.0% | 47.0% |
| 2008 | 47.0% | 48.0% | 43.0% |
| CST U.S. History Test | |||
| 2010 | 59.0% | 58.0% | 45.0% |
| 2009 | 49.0% | 51.0% | 44.0% |
| 2008 | 39.0% | 42.0% | 38.0% |
End of Course - % of students at or above proficiency
| School | District | State | |
|---|---|---|---|
| CST Algebra I Test | |||
| 2010 | 45.0% | 38.0% | 31.0% |
| 2009 | 25.0% | 35.0% | 28.0% |
| 2008 | 15.0% | 33.0% | 25.0% |
| CST Algebra II Test | |||
| 2010 | 36.0% | 35.0% | 31.0% |
| 2009 | 30.0% | 25.0% | 28.0% |
| 2008 | 28.0% | 29.0% | 27.0% |
| CST Biology Test | |||
| 2010 | 62.0% | 56.0% | 46.0% |
| 2009 | 48.0% | 48.0% | 42.0% |
| 2008 | 42.0% | 42.0% | 42.0% |
| CST Chemistry Test | |||
| 2010 | 25.0% | 34.0% | 38.0% |
| 2009 | 33.0% | 34.0% | 36.0% |
| 2008 | 23.0% | 24.0% | 32.0% |
| CST General Mathematics Test | |||
| 2010 | 38.0% | 46.0% | 27.0% |
| 2009 | 37.0% | 43.0% | 26.0% |
| 2008 | 44.0% | 42.0% | 27.0% |
| CST Geometry Test | |||
| 2010 | 30.0% | 35.0% | 27.0% |
| 2009 | 41.0% | 39.0% | 26.0% |
| 2008 | 35.0% | 32.0% | 24.0% |
| CST Integrated/Coordinated Science Test | |||
| 2010 | 11.0% | 10.0% | 16.0% |
| 2009 | 13.0% | 10.0% | 13.0% |
| 2008 | 6.0% | 9.0% | 11.0% |
| CST Physics Test | |||
| 2010 | 81.0% | 81.0% | 49.0% |
| 2009 | 37.0% | 63.0% | 46.0% |
| 2008 | 35.0% | 56.0% | 43.0% |
| CST Summative High School Math Test | |||
| 2010 | 58.0% | 57.0% | 54.0% |
| 2009 | 47.0% | 46.0% | 50.0% |
| 2008 | 47.0% | 47.0% | 47.0% |
| CST World History Test | |||
| 2010 | 55.0% | 53.0% | 41.0% |
| 2009 | 50.0% | 46.0% | 38.0% |
| 2008 | 34.0% | 40.0% | 33.0% |
Source: CA Department of Education 2009-2010
School Map and Similar Schools Nearby
Click to Activate Map of Nearby School Campuses
Private
Public
This School
Similar Schools Nearby
| South San Francisco High School 9-12 | 1,517 Students | 1.6 miles away | Not Yet Rated | |
| Jefferson High School 9-12 | 1,179 Students | 2.5 miles away | Not Yet Rated | |
| Westmoor High School 9-12 | 1,817 Students | 2.6 miles away | Not Yet Rated | |
| Balboa High School 9-12 | 1,295 Students | 3.8 miles away | ![]() 1 out of 5 | |
| Phillip and Sala Burton Academic High School 9-12 | 813 Students | 4.2 miles away | Not Yet Rated | |
| Capuchino High School 9-12 | 1,161 Students | 4.5 miles away | Not Yet Rated | |
| Lowell High School 9-12 | 2,597 Students | 5.0 miles away | ![]() 5 out of 5 | |
| Thurgood Marshall Academic High School 9-12 | 817 Students | 5.2 miles away | Not Yet Rated | |
| School of the Arts 9-12 | 591 Students | 5.5 miles away | Not Yet Rated | |
| Terra Nova High School 9-12 | 1,367 Students | 5.5 miles away | Not Yet Rated | |
Compare This School To Nearby Schools ->
School Community Forum

Join a discussion about El Camino High School and talk to others in the community including students, parents, teachers, and administrators.
Popular Discussion Topics
- Admissions and Registration Questions (e.g. Dress Code and Discipline Policy)
- School Calendar and Upcoming Events (e.g. Graduation)
- After School Programs, Extracurricular Activities, and Athletics (e.g. Football)
- News and Announcements (e.g. Yearbook and Class Supply List Details)
- Graduate and Alumni Events (e.g. Organizing Class Reunions)
Navigation
Can't Find What You Are Looking For?
Rankings
Nearby Cities
Sponsored Links
K-12 Articles
The Difference Between Boys and Girls
Boys and girls are different. Give a toddler girl a G.I. Joe and she'll probably try to mother it....
Helping Your Learning Disabled Child
Thousands of children in America struggle to learn on a daily basis. Many of them have invisible...
Is Your Child Happy at School?
As a parent, you'd love to have your child share all of his feelings with you. It would be so easy...


(5 / 5) 
