Westborough Middle School
2570 Westborough Blvd, South San Francisco, CA 94080 | (650) 877-8848
- Grades: 6-8
- Student Enrollment: 687
Rating
Not Available
Not Available

No Reviews Yet
Find Old Friends From Westborough Middle School
Use the form below to search for alumni from Westborough Middle School.
School Description
School Summary and Highlights
- Enrolls 687 middle school students from grades 6-8
- Ranks 438th out of 2,050 middle schools in CA.
- 2010 Overall School AYP Met Status: Yes
Additional Contact Information
- Mailing Address: 398 B St., South San Francisco, CA 94080
School District Details
- South San Francisco Unified School District
- Per-Pupil Spending: $7,417
- Graduation Rate: 82.8%
- Dropout Rate: 2.2%
- Students Per Teacher: 21.1
- Enrolled Students: 9,319
Faculty Details and Student Enrollment
Students and Faculty
- Total Students Enrolled: 687
- Total Full Time "Equivalent" Teachers: 29.6
- Average Student-To-Teacher Ratio: 23.2
Students Gender Breakdown
- Males: 374 (54.4%)
- Females: 313 (45.6%)
Free Lunch Student Eligibility Breakdown
- Eligible for Reduced Lunch: 65 (9.5%)
- Eligible for Free Lunch: 117 (17.0%)
- Eligible for Either Reduced or Free Lunch: 182 (26.5%)
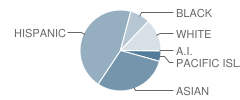
Student Enrollment Distribution by Race / Ethnicity
| Number | Percent | |
|---|---|---|
| American Indian | 1 | 0.1% |
| Black | 27 | 3.9% |
| Asian | 100 | 14.6% |
| Hispanic | 149 | 21.7% |
| White | 43 | 6.3% |
Number of Students Per Grade

| Number | Percent | |
|---|---|---|
| 6th Grade | 216 | 31.4% |
| 7th Grade | 229 | 33.3% |
| 8th Grade | 242 | 35.2% |
Teacher Education Background (2009)
Percent With Master's Degree
School:
22.6%
District:
11.1%
Percent With Bachelor's Degree: 9.7%
Teacher Credentials & Experience (2009)
Percent of Teachers With Credentials: 89.3%
Number of Certificated Staff: 31.0
Average Number of Years of Teacher Experience: 14.6
Average Age
School:
42.2
District:
46.0
Source: CA Department of Education, Source: NCES 2009-2010
School Ratings and Reviews
Be The First To Review Westborough Middle School!
School Map and Similar Schools Nearby
Click to Activate Map of Nearby School Campuses
Private
Public
This School
Similar Schools Nearby
| Alta Loma Middle School 6-8 | 777 Students | 1.3 miles away | Not Yet Rated | |
| Rollingwood Elementary School KG-6 | 256 Students | 1.3 miles away | Not Yet Rated | |
| Portola Elementary School KG-6 | 245 Students | 1.4 miles away |  4 out of 5 | |
| Ocean Shore Elementary School KG-8 | 354 Students | 1.7 miles away |  5 out of 5 | |
| Ingrid B. Lacy Middle School 6-8 | 599 Students | 1.7 miles away | Not Yet Rated | |
| Franklin Delano Roosevelt Elementary School KG-6 | 321 Students | 1.9 miles away | Not Yet Rated | |
| Crestmoor Elementary School KG-6 | 225 Students | 2.0 miles away | 5 out of 5 | |
| Parkway Heights Middle School 6-8 | 542 Students | 2.4 miles away | Not Yet Rated | |
| Vallemar Elementary School KG-8 | 557 Students | 2.5 miles away | Not Yet Rated | |
| John Muir Elementary School KG-6 | 337 Students | 2.5 miles away | 5 out of 5 | |
Compare This School To Nearby Schools ->
School Community Forum

Join a discussion about Westborough Middle School and talk to others in the community including students, parents, teachers, and administrators.
Popular Discussion Topics
- Admissions and Registration Questions (e.g. Dress Code and Discipline Policy)
- School Calendar and Upcoming Events (e.g. Graduation)
- After School Programs, Extracurricular Activities, and Athletics (e.g. Football)
- News and Announcements (e.g. Yearbook and Class Supply List Details)
- Graduate and Alumni Events (e.g. Organizing Class Reunions)
Navigation
Can't Find What You Are Looking For?
Rankings
Nearby Cities
Sponsored Links
K-12 Articles

Democracy in Action
There is still over a year until the general election, but the election cycle has been in full...
There is still over a year until the general election, but the election cycle has been in full...

Cell Phones... the Best Thing Since Sliced Bread or the Worst Invention in the World?
Cell phones are wonderful, the best things humans have ever invented! They help us keep in touch...
Cell phones are wonderful, the best things humans have ever invented! They help us keep in touch...

Helping Your Learning Disabled Child
Thousands of children in America struggle to learn on a daily basis. Many of them have invisible...
Thousands of children in America struggle to learn on a daily basis. Many of them have invisible...