Granger Junior High School
Rating
Not Available
Not Available

3.5 out of 5 | 3 Reviews
Find Old Friends From Granger Junior High School
Use the form below to search for alumni from Granger Junior High School.
School Description
School Summary and Highlights
- Enrolls 1,079 middle and high school students from grades 7-9
- Ranks 487th out of 1,197 high schools in CA.
- 2010 Overall School AYP Met Status: Yes
Additional Contact Information
- Mailing Address: 2101 Granger Ave., National City, CA 91950
School Operational Details
- Title I EligibleAll students of this school are eligible for participation in authorized programs.
School District Details
- Sweetwater Union High School District
- Per-Pupil Spending: $9,219
- Graduation Rate: 83.5%
- Dropout Rate: 3.9%
- Students Per Teacher: 23.4
- Enrolled Students: 42,224
Faculty Details and Student Enrollment
Students and Faculty
- Total Students Enrolled: 1,079
- Total Full Time "Equivalent" Teachers: 50.0
- Average Student-To-Teacher Ratio: 21.6
Students Gender Breakdown
- Males: 550 (51.0%)
- Females: 529 (49.0%)
Free Lunch Student Eligibility Breakdown
- Eligible for Reduced Lunch: 208 (19.3%)
- Eligible for Free Lunch: 774 (71.7%)
- Eligible for Either Reduced or Free Lunch: 982 (91.0%)
Student Enrollment Distribution by Race / Ethnicity
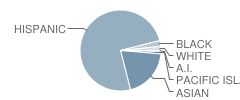
| Number | Percent | |
|---|---|---|
| American Indian | 6 | 0.6% |
| Black | 26 | 2.4% |
| Asian | 210 | 19.5% |
| Hispanic | 796 | 73.8% |
| White | 19 | 1.8% |
Number of Students Per Grade
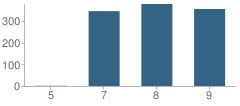
| Number | Percent | |
|---|---|---|
| 5th Grade | 1 | 0.09% |
| 7th Grade | 345 | 32.0% |
| 8th Grade | 378 | 35.0% |
| 9th Grade | 355 | 32.9% |
Teacher Education Background (2009)
Percent With Master's Degree
School:
37.5%
District:
37.9%
Percent With Bachelor's Degree
School:
5.4%
District:
5.6%
Teacher Credentials & Experience (2009)
Percent of Teachers With Credentials: 95.8%
Number of Certificated Staff: 56.0
Average Number of Years of Teacher Experience: 10.9
Average Age
School:
42.2
District:
46.5
Source: CA Department of Education, Source: NCES 2009-2010
School Ratings and Reviews
Overall Rating: 3.5

3.5 out of 5 | 3 Reviews
The Overall Rating is the school's average rating from parents, students, school faculty and staff. The highest rating is five apples and the lowest is one apple.
Share Your Review About This School
3 reviews for Granger Junior High School
- Reviewed by Parent or Guardian on February 22, 2011
- Rating:
 (1 / 5) Flag as inappropriate
 - This school is more concerned with uniform policy then the kid.
- Reviewed by Former Student on January 01, 2011
- Rating:
 (4 / 5) Flag as inappropriate
 - I'm looking for a 1964 yearbook
from Granger Jr. High School.
- Reviewed by Parent/Guardian on January 30, 2009
- Rating:
 (5 / 5) Flag as inappropriate
 - nothing
School Map and Similar Schools Nearby
Click to Activate Map of Nearby School Campuses
Private
Public
This School
Similar Schools Nearby
| Sweetwater High School 9-12 | 2,456 Students | 1.4 miles away |  1 out of 5 | |
| Hilltop High School 9-12 | 2,318 Students | 2.6 miles away | Not Yet Rated | |
| Chula Vista High School 9-12 | 2,662 Students | 3.5 miles away |  5 out of 5 | |
| Bonita Vista High School 9-12 | 2,368 Students | 4.6 miles away |  3.5 out of 5 | |
| Castle Park High School 9-12 | 1,579 Students | 4.7 miles away | Not Yet Rated | |
| Mount Miguel High School 9-12 | 1,901 Students | 4.8 miles away | 5 out of 5 | |
| Otay Ranch High School 9-12 | 2,705 Students | 6.2 miles away | 5 out of 5 | |
| Eastlake High School 9-12 | 2,467 Students | 6.6 miles away | Not Yet Rated | |
| Mar Vista High School 9-12 | 1,775 Students | 7.0 miles away |  4 out of 5 | |
| Monte Vista High School 9-12 | 2,096 Students | 7.4 miles away | Not Yet Rated | |
Compare This School To Nearby Schools ->
School Community Forum

Join a discussion about Granger Junior High School and talk to others in the community including students, parents, teachers, and administrators.
Popular Discussion Topics
- Admissions and Registration Questions (e.g. Dress Code and Discipline Policy)
- School Calendar and Upcoming Events (e.g. Graduation)
- After School Programs, Extracurricular Activities, and Athletics (e.g. Football)
- News and Announcements (e.g. Yearbook and Class Supply List Details)
- Graduate and Alumni Events (e.g. Organizing Class Reunions)
Navigation
Can't Find What You Are Looking For?
Rankings
Nearby Cities
Sponsored Links
K-12 Articles

School Lunches ... Hot or Cold?
First there were four, now there are six, no one knows how many more there may be in the future....
First there were four, now there are six, no one knows how many more there may be in the future....

Tips for Purchasing Back to School Supplies
In just a few days, kids from all over the US will be going back to school. Now is the time to take...
In just a few days, kids from all over the US will be going back to school. Now is the time to take...

Public or Private?
Daniel attended private school until sixth grade, when he was diagnosed with Asperger's Syndrome, a...
Daniel attended private school until sixth grade, when he was diagnosed with Asperger's Syndrome, a...