Mar Vista High School
Rating
Not Available
Not Available

4 out of 5 | 5 Reviews
Find Old Friends From Mar Vista High School
Use the form below to search for alumni from Mar Vista High School.
School Description
School Summary and Highlights
- Enrolls 1,775 high school students from grades 9-12
- Ranks 853rd out of 1,197 high schools in CA.
- 2010 Overall School AYP Met Status: No
Additional Contact Information
- Mailing Address: 505 Elm Ave., Imperial Beach, CA 91932
School Operational Details
- Title I EligibleAll students of this school are eligible for participation in authorized programs.
School District Details
- Sweetwater Union High School District
- Per-Pupil Spending: $9,219
- Graduation Rate: 83.5%
- Dropout Rate: 3.9%
- Students Per Teacher: 23.4
- Enrolled Students: 42,224
Faculty Details and Student Enrollment
Students and Faculty
- Total Students Enrolled: 1,775
- Total Full Time "Equivalent" Teachers: 86.1
- Average Student-To-Teacher Ratio: 20.6
Students Gender Breakdown
- Males: 951 (53.6%)
- Females: 824 (46.4%)
Free Lunch Student Eligibility Breakdown
- Eligible for Reduced Lunch: 231 (13.0%)
- Eligible for Free Lunch: 939 (52.9%)
- Eligible for Either Reduced or Free Lunch: 1,170 (65.9%)
Student Enrollment Distribution by Race / Ethnicity
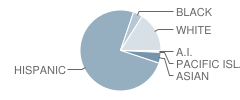
| Number | Percent | |
|---|---|---|
| American Indian | 11 | 0.6% |
| Black | 66 | 3.7% |
| Asian | 75 | 4.2% |
| Hispanic | 1,285 | 72.4% |
| White | 275 | 15.5% |
Number of Students Per Grade
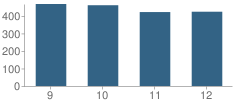
| Number | Percent | |
|---|---|---|
| 9th Grade | 468 | 26.4% |
| 10th Grade | 461 | 26.0% |
| 11th Grade | 422 | 23.8% |
| 12th Grade | 424 | 23.9% |
Graduates Information (2010)
Graduation Rate
School:
89.9%
District:
85.0%
State:
78.6%
Teacher Education Background (2009)
Percent With Ph.D.
School:
2.0%
District:
6.8%
Percent With Master's Degree
School:
32.4%
District:
37.9%
Percent With Bachelor's Degree
School:
2.9%
District:
5.6%
Teacher Credentials & Experience (2009)
Percent of Teachers With Credentials: 100.0%
Number of Certificated Staff: 102.0
Average Number of Years of Teacher Experience: 12.0
Average Age
School:
43.2
District:
46.5
Source: CA Department of Education, Source: NCES 2009-2010
School Ratings and Reviews
Overall Rating: 4

4 out of 5 | 5 Reviews
The Overall Rating is the school's average rating from parents, students, school faculty and staff. The highest rating is five apples and the lowest is one apple.
Share Your Review About This School
5 reviews for Mar Vista High School
- Reviewed by Student on October 08, 2010
- Rating:
 (5 / 5) Flag as inappropriate
 - I think mar vista high is a bad school
to Go to Iam glad Iam out of there
that school sucks Iam tell you ok.
- Reviewed by Student on October 30, 2009
- Rating: (5 / 5) Flag as inappropriate
- Haha, Hi I'm now attending Mar Vista High School, and when i read all of thses things ...' reviews ' sayin so much with gang violence? HAH my but. loool. Mar Vista Is a really good school, it may not be the " BEST " or RICHEST school ever, but the teachers teach an amazing way, i have to admit. Our sport thing is great too( haha except our football team sucks ) :) And We do have clique problems but just the Preppy people :D thats all, :) go mariners! :D ..i just hate the name too.. lol :D
- Reviewed by Former Student on July 27, 2009
- Rating: (5 / 5) Flag as inappropriate
- Honestly im a graduate from Mar Vista High and i thought it was a great school. Class of 04..not much gangs in there..i mean a few but what high school doesnt u know..well Go MARINERS!!!!!!!!
- Reviewed by Parent/Guardian on June 07, 2009
- Rating:
 (3 / 5) Flag as inappropriate
 - Academics are ok with teachers who care. Athletic programs are questionable with coaches collecting a check for the most part. No problems with drugs from this parent but as another review stated it's how you raise your children. Best choice between SW, San Ysidro, and Mar Vista.
- Reviewed by Parent/Guardian on January 03, 2009
- Rating:
 (1 / 5) Flag as inappropriate
 - Of all schools I could have ended up at. Mar Vista IS a gang infested school with no control over the students, and no proper procedures of dealing with gang violence. Students are often segregated and forced to hang out in certain areas of the school despite religion, beliefs, and upbringing. It's not the child who is to blame here. Its the state and what they are doing to prevent such a negative environment.
School Map and Similar Schools Nearby
Click to Activate Map of Nearby School Campuses
Private
Public
This School
Similar Schools Nearby
| Chula Vista High School 9-12 | 2,662 Students | 3.9 miles away |  5 out of 5 | |
| Castle Park High School 9-12 | 1,579 Students | 4.4 miles away | Not Yet Rated | |
| Hilltop High School 9-12 | 2,318 Students | 5.3 miles away | Not Yet Rated | |
| Sweetwater High School 9-12 | 2,456 Students | 5.8 miles away |  1 out of 5 | |
| Granger Junior High School 7-9 | 1,079 Students | 7.0 miles away |  3.5 out of 5 | |
| Otay Ranch High School 9-12 | 2,705 Students | 7.9 miles away | 5 out of 5 | |
| Bonita Vista High School 9-12 | 2,368 Students | 8.4 miles away | 3.5 out of 5 | |
| Olympian High School 9-12 | 1,565 Students | 9.1 miles away | Not Yet Rated | |
| Eastlake High School 9-12 | 2,467 Students | 10.2 miles away | Not Yet Rated | |
| Mount Miguel High School 9-12 | 1,901 Students | 11.6 miles away | 5 out of 5 | |
Compare This School To Nearby Schools ->
School Community Forum

Join a discussion about Mar Vista High School and talk to others in the community including students, parents, teachers, and administrators.
Popular Discussion Topics
- Admissions and Registration Questions (e.g. Dress Code and Discipline Policy)
- School Calendar and Upcoming Events (e.g. Graduation)
- After School Programs, Extracurricular Activities, and Athletics (e.g. Football)
- News and Announcements (e.g. Yearbook and Class Supply List Details)
- Graduate and Alumni Events (e.g. Organizing Class Reunions)
Navigation
Can't Find What You Are Looking For?
Rankings
Nearby Cities
Sponsored Links
K-12 Articles

Summer Reading
In 1998, a book was published in the US that turned a hatred of reading to love. "Harry Potter and...
In 1998, a book was published in the US that turned a hatred of reading to love. "Harry Potter and...

Tips for Purchasing Back to School Supplies
In just a few days, kids from all over the US will be going back to school. Now is the time to take...
In just a few days, kids from all over the US will be going back to school. Now is the time to take...

Those Pesky Little Transitions
Transitions are rarely easy, yet we have to encounter them every day of our lives. For school-aged...
Transitions are rarely easy, yet we have to encounter them every day of our lives. For school-aged...