Tamalpais High School

No Reviews Yet
Find Old Friends From Tamalpais High School
Use the form below to search for alumni from Tamalpais High School.
School Description
School Summary and Highlights
- Enrolls 1,110 high school students from grades 9-12
- Ranks 136th out of 1,197 high schools in CA.
- 2010 Overall School AYP Met Status: Yes
Additional Contact Information
- Mailing Address: 700 Miller Ave., Mill Valley, CA 94941
School Operational Details
- Title I Eligible
School District Details
- Tamalpais Union High School District
- Per-Pupil Spending: $13,834
- Dropout Rate: 0.7%
- Students Per Teacher: 17.3
- Enrolled Students: 3,797
Faculty Details and Student Enrollment
Students and Faculty
- Total Students Enrolled: 1,110
- Total Full Time "Equivalent" Teachers: 61.1
- Average Student-To-Teacher Ratio: 18.2
Students Gender Breakdown
- Males: 567 (51.1%)
- Females: 543 (48.9%)
Free Lunch Student Eligibility Breakdown
- Eligible for Reduced Lunch: 17 (1.5%)
- Eligible for Free Lunch: 43 (3.9%)
- Eligible for Either Reduced or Free Lunch: 60 (5.4%)
Student Enrollment Distribution by Race / Ethnicity
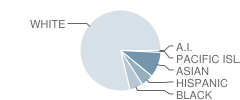
| Number | Percent | |
|---|---|---|
| American Indian | 1 | 0.09% |
| Black | 57 | 5.1% |
| Asian | 108 | 9.7% |
| Hispanic | 53 | 4.8% |
| White | 836 | 75.3% |
Number of Students Per Grade
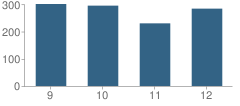
| Number | Percent | |
|---|---|---|
| 9th Grade | 301 | 27.1% |
| 10th Grade | 295 | 26.6% |
| 11th Grade | 230 | 20.7% |
| 12th Grade | 284 | 25.6% |
Graduates Information (2010)
Graduation Rate
School:
98.3%
District:
97.1%
State:
78.6%
Teacher Education Background (2009)
Percent With Ph.D.
School:
5.1%
District:
12.5%
Percent With Master's Degree
School:
29.1%
District:
12.5%
Percent With Bachelor's Degree: 3.8%
Teacher Credentials & Experience (2009)
Percent of Teachers With Credentials: 98.6%
Number of Certificated Staff: 79.0
Average Number of Years of Teacher Experience: 13.8
Average Age
School:
42.9
District:
43.5
Source: CA Department of Education, Source: NCES 2009-2010
School Ratings and Reviews
Be The First To Review Tamalpais High School!
Sponsored Links
Test Scores and Performance Information
Overall School Rating
How is this determined?
The overall school rating shows that Tamalpais High School performed on average better than many other schools across the state on CST state exams in the following subjects:
- CST Algebra I
- CST Algebra II
- CST Biology
- CST Chemistry
- CST Earth Science
- CST English-Language Arts
- CST General Mathematics
- CST Geometry
- CST Science
- CST Summative High School Math
- CST U.S. History
- CST World History
AYP Results (2010)
Overall AYP Met: Yes
ELA AYP Met: Yes
Math AYP Met: Yes
ACT Exam Results (2009)
Percent of Students Taking ACT Exam: 34.3%
Average Combined Score: 25.8
Percent Scoring At or Above 21: 86.4%
SAT Exam Results (2009)
Percent of Students Taking SAT Exam: 67.7%
Average Combined Score: 1,743.3
Critical Reading Average: 582.8
Math Average: 576.4
Writing Average: 584.1
Percent Scoring At or Above 1500: 79.8%
CST - Test Proficiency by Grade and Subject
Grade 9 - % of students at or above proficiency
| School | District | State | |
|---|---|---|---|
| CST Algebra I Test | |||
| 2010 | 46.0% | 46.0% | 22.0% |
| 2009 | 52.0% | 53.0% | 21.0% |
| 2008 | 42.0% | 42.0% | 18.0% |
| CST Earth Science Test | |||
| 2010 | 67.0% | 74.0% | 35.0% |
| 2009 | 63.0% | 65.0% | 29.0% |
| 2008 | 74.0% | 71.0% | 31.0% |
| CST English-Language Arts Test | |||
| 2010 | 75.0% | 82.0% | 54.0% |
| 2009 | 83.0% | 83.0% | 50.0% |
| 2008 | 78.0% | 82.0% | 49.0% |
| CST General Mathematics Test | |||
| 2010 | 11.0% | 27.0% | 17.0% |
| 2009 | 27.0% | 31.0% | 17.0% |
| 2008 | 24.0% | 21.0% | 18.0% |
| CST Geometry Test | |||
| 2010 | 80.0% | 80.0% | 46.0% |
| 2009 | 73.0% | 80.0% | 47.0% |
| 2008 | 69.0% | 77.0% | 43.0% |
| CST Algebra II Test | |||
| 2009 | 65.0% | 69.0% | 65.0% |
| 2008 | 78.0% | 76.0% | 66.0% |
Grade 10 - % of students at or above proficiency
| School | District | State | |
|---|---|---|---|
| CST Algebra I Test | |||
| 2010 | 3.0% | 19.0% | 12.0% |
| 2009 | 12.0% | 25.0% | 11.0% |
| 2008 | 25.0% | 24.0% | 9.0% |
| CST Algebra II Test | |||
| 2010 | 45.0% | 49.0% | 40.0% |
| 2009 | 34.0% | 44.0% | 37.0% |
| 2008 | 45.0% | 45.0% | 36.0% |
| CST Biology Test | |||
| 2010 | 76.0% | 77.0% | 38.0% |
| 2009 | 79.0% | 75.0% | 34.0% |
| 2008 | 81.0% | 79.0% | 35.0% |
| CST English-Language Arts Test | |||
| 2010 | 76.0% | 77.0% | 45.0% |
| 2009 | 81.0% | 77.0% | 44.0% |
| 2008 | 72.0% | 73.0% | 41.0% |
| CST Geometry Test | |||
| 2010 | 18.0% | 27.0% | 14.0% |
| 2009 | 11.0% | 29.0% | 14.0% |
| 2008 | 21.0% | 25.0% | 12.0% |
| CST Science Test | |||
| 2010 | 80.0% | 78.0% | 46.0% |
| 2009 | 80.0% | 80.0% | 44.0% |
| 2008 | 74.0% | 75.0% | 40.0% |
| CST Summative High School Math Test | |||
| 2010 | 86.0% | 89.0% | 75.0% |
| 2009 | 92.0% | 95.0% | 71.0% |
| 2008 | 92.0% | 95.0% | 68.0% |
| CST World History Test | |||
| 2010 | 75.0% | 72.0% | 42.0% |
| 2009 | 80.0% | 74.0% | 38.0% |
| 2008 | 69.0% | 70.0% | 33.0% |
| CST Earth Science Test | |||
| 2009 | 22.0% | 50.0% | 23.0% |
| 2008 | 26.0% | 62.0% | 23.0% |
Grade 11 - % of students at or above proficiency
| School | District | State | |
|---|---|---|---|
| CST Algebra II Test | |||
| 2010 | 11.0% | 13.0% | 14.0% |
| 2009 | 10.0% | 8.0% | 12.0% |
| 2008 | 5.0% | 8.0% | 11.0% |
| CST Biology Test | |||
| 2010 | 65.0% | 65.0% | 46.0% |
| 2009 | 80.0% | 70.0% | 41.0% |
| 2008 | 68.0% | 62.0% | 39.0% |
| CST Chemistry Test | |||
| 2010 | 85.0% | 77.0% | 30.0% |
| 2009 | 82.0% | 78.0% | 27.0% |
| 2008 | 83.0% | 71.0% | 25.0% |
| CST English-Language Arts Test | |||
| 2010 | 73.0% | 72.0% | 42.0% |
| 2009 | 77.0% | 76.0% | 40.0% |
| 2008 | 72.0% | 71.0% | 37.0% |
| CST Summative High School Math Test | |||
| 2010 | 61.0% | 63.0% | 50.0% |
| 2009 | 58.0% | 57.0% | 47.0% |
| 2008 | 66.0% | 62.0% | 43.0% |
| CST U.S. History Test | |||
| 2010 | 78.0% | 74.0% | 45.0% |
| 2009 | 80.0% | 77.0% | 44.0% |
| 2008 | 70.0% | 70.0% | 38.0% |
| CST Geometry Test | |||
| 2009 | 11.0% | 15.0% | 7.0% |
| 2008 | 3.0% | 9.0% | 6.0% |
End of Course - % of students at or above proficiency
| School | District | State | |
|---|---|---|---|
| CST Algebra I Test | |||
| 2010 | 37.0% | 37.0% | 31.0% |
| 2009 | 45.0% | 45.0% | 28.0% |
| 2008 | 39.0% | 35.0% | 25.0% |
| CST Algebra II Test | |||
| 2010 | 34.0% | 33.0% | 31.0% |
| 2009 | 28.0% | 28.0% | 28.0% |
| 2008 | 33.0% | 32.0% | 27.0% |
| CST Biology Test | |||
| 2010 | 72.0% | 72.0% | 46.0% |
| 2009 | 79.0% | 72.0% | 42.0% |
| 2008 | 76.0% | 72.0% | 42.0% |
| CST Chemistry Test | |||
| 2010 | 85.0% | 77.0% | 38.0% |
| 2009 | 81.0% | 78.0% | 36.0% |
| 2008 | 83.0% | 72.0% | 32.0% |
| CST Earth Science Test | |||
| 2010 | 65.0% | 72.0% | 33.0% |
| 2009 | 58.0% | 61.0% | 28.0% |
| 2008 | 69.0% | 69.0% | 28.0% |
| CST General Mathematics Test | |||
| 2010 | 11.0% | 27.0% | 27.0% |
| 2009 | 27.0% | 31.0% | 26.0% |
| 2008 | 24.0% | 21.0% | 27.0% |
| CST Geometry Test | |||
| 2010 | 44.0% | 52.0% | 27.0% |
| 2009 | 44.0% | 53.0% | 26.0% |
| 2008 | 40.0% | 47.0% | 24.0% |
| CST Summative High School Math Test | |||
| 2010 | 65.0% | 65.0% | 54.0% |
| 2009 | 65.0% | 60.0% | 50.0% |
| 2008 | 69.0% | 64.0% | 47.0% |
| CST World History Test | |||
| 2010 | 74.0% | 71.0% | 41.0% |
| 2009 | 79.0% | 72.0% | 38.0% |
| 2008 | 69.0% | 68.0% | 33.0% |
Source: CA Department of Education 2009-2010
School Map and Similar Schools Nearby
Click to Activate Map of Nearby School Campuses
Private
Public
This School
Similar Schools Nearby
| Redwood High School 9-12 | 1,442 Students | 3.3 miles away | ![]() 5 out of 5 | |
| San Rafael High School 9-12 | 921 Students | 5.6 miles away | Not Yet Rated | |
| Sir Francis Drake High School 9-12 | 1,049 Students | 6.8 miles away | Not Yet Rated | |
| Terra Linda High School 9-12 | 1,112 Students | 7.6 miles away | Not Yet Rated | |
| George Washington High School 9-12 | 2,283 Students | 8.1 miles away | Not Yet Rated | |
| Galileo Academy of Science & Technology 9-12 | 2,090 Students | 8.3 miles away | Not Yet Rated | |
| Raoul Wallenberg Traditional High School 9-12 | 613 Students | 8.9 miles away | ![]() 4 out of 5 | |
| Newcomer High School 9-12 | 156 Students | 9.5 miles away | Not Yet Rated | |
Compare This School To Nearby Schools ->
School Community Forum

Join a discussion about Tamalpais High School and talk to others in the community including students, parents, teachers, and administrators.
Popular Discussion Topics
- Admissions and Registration Questions (e.g. Dress Code and Discipline Policy)
- School Calendar and Upcoming Events (e.g. Graduation)
- After School Programs, Extracurricular Activities, and Athletics (e.g. Football)
- News and Announcements (e.g. Yearbook and Class Supply List Details)
- Graduate and Alumni Events (e.g. Organizing Class Reunions)
Navigation
Can't Find What You Are Looking For?
Rankings
Nearby Cities
Sponsored Links
K-12 Articles
Changing Schools Isn't Easy: Tips for a Successful Transition
It isn't easy for students to make the transition into a new school, especially if they have...
The Very Best Things in the World
A recent poll in the U.K. revealed that children view the "very best thing in the world" as being...
Those Pesky Little Transitions
Transitions are rarely easy, yet we have to encounter them every day of our lives. For school-aged...


