Jacobsen Middle School
Rating
Not Available
Not Available

5 out of 5 | 2 Reviews
Find Old Friends From Jacobsen Middle School
Use the form below to search for alumni from Jacobsen Middle School.
School Description
School Summary and Highlights
- Enrolls 1,130 middle school students from grades 6-8
- Ranks 1023rd out of 2,050 middle schools in CA.
- 2010 Overall School AYP Met Status: No
Additional Contact Information
- Mailing Address: 711 Anita Dr., Tehachapi, CA 93561
School District Details
- Tehachapi Unified School District
- Per-Pupil Spending: $7,790
- Graduation Rate: 80.9%
- Dropout Rate: 4.9%
- Students Per Teacher: 23.0
- Enrolled Students: 4,817
Faculty Details and Student Enrollment
Students and Faculty
- Total Students Enrolled: 1,130
- Total Full Time "Equivalent" Teachers: 46.8
- Average Student-To-Teacher Ratio: 24.2
Students Gender Breakdown
- Males: 626 (55.4%)
- Females: 504 (44.6%)
Free Lunch Student Eligibility Breakdown
- Eligible for Reduced Lunch: 86 (7.6%)
- Eligible for Free Lunch: 287 (25.4%)
- Eligible for Either Reduced or Free Lunch: 373 (33.0%)
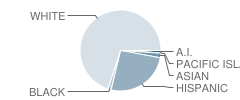
Student Enrollment Distribution by Race / Ethnicity
| Number | Percent | |
|---|---|---|
| American Indian | 11 | 1.0% |
| Black | 15 | 1.3% |
| Asian | 21 | 1.9% |
| Hispanic | 287 | 25.4% |
| White | 775 | 68.6% |
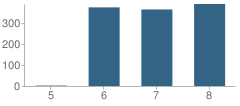
Number of Students Per Grade
| Number | Percent | |
|---|---|---|
| 5th Grade | 2 | 0.2% |
| 6th Grade | 374 | 33.1% |
| 7th Grade | 364 | 32.2% |
| 8th Grade | 390 | 34.5% |
Teacher Education Background (2009)
Percent With Master's Degree
School:
28.6%
District:
40.0%
Percent With Bachelor's Degree
School:
4.1%
District:
13.3%
Teacher Credentials & Experience (2009)
Percent of Teachers With Credentials: 97.8%
Number of Certificated Staff: 49.0
Average Number of Years of Teacher Experience: 16.5
Average Age
School:
47.4
District:
47.9
Source: CA Department of Education, Source: NCES 2009-2010
School Ratings and Reviews
Overall Rating: 5

5 out of 5 | 2 Reviews
The Overall Rating is the school's average rating from parents, students, school faculty and staff. The highest rating is five apples and the lowest is one apple.
Share Your Review About This School
2 reviews for Jacobsen Middle School
- Reviewed by Parent or Guardian on March 20, 2011
- Rating:
 (5 / 5) Flag as inappropriate
 - it's a good school
- Reviewed by Parent/Guardian on December 16, 2008
- Rating: (5 / 5) Flag as inappropriate
- The school has an excellent teacher and staff.My child comes home with new knowledge everyday,and a story on how fun it was to learn it. It is a very safe school,but it tends to give a little too much homework. My child somtimes comes home and does her homework for about 2 or 3 hours.
School Map and Similar Schools Nearby
Click to Activate Map of Nearby School Campuses
Private
Public
This School
Similar Schools Nearby
| Joshua School KG-6 | 95 Students | 14.9 miles away |  5 out of 5 | |
| Piute Mountain Elementary School KG-8 | 74 Students | 15.5 miles away | Not Yet Rated | |
| Caliente Elementary School KG-8 | 2 Students | 15.6 miles away | 5 out of 5 | - |
| Mojave High School 7-12 | 410 Students | 16.0 miles away |  4 out of 5 | |
| Di Giorgio Elementary School KG-8 | 209 Students | 21.3 miles away | Not Yet Rated | |
| Tropico Middle School 6-8 | 763 Students | 21.5 miles away |  3 out of 5 | |
| Sierra Vista Elementary School KG-6 | 895 Students | 22.8 miles away | Not Yet Rated | |
| Haven Drive Middle School 7-8 | 708 Students | 22.9 miles away | 5 out of 5 | |
| El Camino Real Elementary School KG-6 | 877 Students | 22.9 miles away | Not Yet Rated | - |
| Bear Mountain Elementary School KG-6 | 868 Students | 23.6 miles away | Not Yet Rated | |
Compare This School To Nearby Schools ->
School Community Forum

Join a discussion about Jacobsen Middle School and talk to others in the community including students, parents, teachers, and administrators.
Popular Discussion Topics
- Admissions and Registration Questions (e.g. Dress Code and Discipline Policy)
- School Calendar and Upcoming Events (e.g. Graduation)
- After School Programs, Extracurricular Activities, and Athletics (e.g. Football)
- News and Announcements (e.g. Yearbook and Class Supply List Details)
- Graduate and Alumni Events (e.g. Organizing Class Reunions)
Navigation
Can't Find What You Are Looking For?
Rankings
Nearby Cities
Sponsored Links
K-12 Articles

Idle Hands
The worst affliction affecting our kids today is not teen pregnancy, drugs and alcohol, or...
The worst affliction affecting our kids today is not teen pregnancy, drugs and alcohol, or...

Simple Math ... a Simple Gift
Math affects every aspect of our lives-from balancing the checkbook to estimating the amount of...
Math affects every aspect of our lives-from balancing the checkbook to estimating the amount of...

When Bad Report Cards Happen to Good Kids
It's mid-term season once again, and semester (or quarter or trimester) grades will be coming out...
It's mid-term season once again, and semester (or quarter or trimester) grades will be coming out...