Templeton High School
Rating
Not Available
Not Available

No Reviews Yet
Find Old Friends From Templeton High School
Use the form below to search for alumni from Templeton High School.
School Description
School Summary and Highlights
- Enrolls 770 high school students from grades 9-12
- Ranks 154th out of 1,197 high schools in CA.
- 2010 Overall School AYP Met Status: Yes
- National Blue Ribbon Schools Award 2006

Additional Contact Information
- Mailing Address: 1200 Main St., Templeton, CA 93465
School District Details
- Templeton Unified School District
- Per-Pupil Spending: $8,215
- Graduation Rate: 94.1%
- Dropout Rate: 1.5%
- Students Per Teacher: 22.6
- Enrolled Students: 2,334
Faculty Details and Student Enrollment
Students and Faculty
- Total Students Enrolled: 770
- Total Full Time "Equivalent" Teachers: 36.0
- Average Student-To-Teacher Ratio: 21.4
Students Gender Breakdown
- Males: 381 (49.5%)
- Females: 389 (50.5%)
Free Lunch Student Eligibility Breakdown
- Eligible for Reduced Lunch: 32 (4.2%)
- Eligible for Free Lunch: 45 (5.8%)
- Eligible for Either Reduced or Free Lunch: 77 (10.0%)
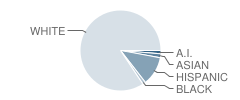
Student Enrollment Distribution by Race / Ethnicity
| Number | Percent | |
|---|---|---|
| American Indian | 10 | 1.3% |
| Black | 9 | 1.2% |
| Asian | 12 | 1.6% |
| Hispanic | 88 | 11.4% |
| White | 641 | 83.2% |
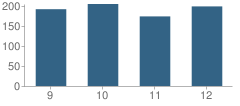
Number of Students Per Grade
| Number | Percent | |
|---|---|---|
| 9th Grade | 192 | 24.9% |
| 10th Grade | 205 | 26.6% |
| 11th Grade | 174 | 22.6% |
| 12th Grade | 199 | 25.8% |
Graduates Information (2010)
Graduation Rate
School:
99.4%
District:
97.6%
State:
78.6%
Teacher Education Background (2009)
Percent With Master's Degree
School:
13.3%
District:
25.0%
Percent With Bachelor's Degree: 2.2%
Teacher Credentials & Experience (2009)
Percent of Teachers With Credentials: 97.4%
Number of Certificated Staff: 45.0
Average Number of Years of Teacher Experience: 14.3
Average Age
School:
43.4
District:
45.8
Source: CA Department of Education, Source: NCES 2009-2010
School Ratings and Reviews
Be The First To Review Templeton High School!
School Map and Similar Schools Nearby
Click to Activate Map of Nearby School Campuses
Private
Public
This School
Similar Schools Nearby
| Atascadero Junior High School 7-8 | 642 Students | 4.2 miles away |  5 out of 5 | |
| Atascadero High School 9-12 | 1,520 Students | 4.5 miles away |  2 out of 5 | |
| Paso Robles High School 9-12 | 2,014 Students | 5.7 miles away | Not Yet Rated | |
| Independence High School 9-12 | 202 Students | 7.1 miles away | Not Yet Rated | - |
| Morro Bay High School 9-12 | 857 Students | 13.9 miles away | Not Yet Rated | |
| Coast Union High School 9-12 | 236 Students | 18.0 miles away | Not Yet Rated | |
| San Luis Obispo High School 9-12 | 1,530 Students | 18.2 miles away | Not Yet Rated | |
| Shandon High / Middle School 9-12 | 95 Students | 20.4 miles away | Not Yet Rated | |
Compare This School To Nearby Schools ->
School Community Forum

Join a discussion about Templeton High School and talk to others in the community including students, parents, teachers, and administrators.
Popular Discussion Topics
- Admissions and Registration Questions (e.g. Dress Code and Discipline Policy)
- School Calendar and Upcoming Events (e.g. Graduation)
- After School Programs, Extracurricular Activities, and Athletics (e.g. Football)
- News and Announcements (e.g. Yearbook and Class Supply List Details)
- Graduate and Alumni Events (e.g. Organizing Class Reunions)
Navigation
Can't Find What You Are Looking For?
Rankings
Nearby Cities
Sponsored Links
K-12 Articles

What to Do when Your Student is Held Back
Kids develop at different speeds, and everyone has different skills and abilities. School is easy...
Kids develop at different speeds, and everyone has different skills and abilities. School is easy...

Summer Safety Tips to Keep Kids Safe
It won't be long until kids run from the school, shrieking in delight because they're free for the...
It won't be long until kids run from the school, shrieking in delight because they're free for the...

The First Day of School
The first day of kindergarten is a rite of passage for any student. Every mother cries and...
The first day of kindergarten is a rite of passage for any student. Every mother cries and...