South High School

No Reviews Yet
Find Old Friends From South High School
Use the form below to search for alumni from South High School.
School Description
School Summary and Highlights
- Enrolls 2,234 high school students from grades 9-12
- Ranks 242nd out of 1,197 high schools in CA.
- 2010 Overall School AYP Met Status: Yes
Additional Contact Information
- Mailing Address: 4801 Pacific Coast Hwy., Torrance, CA 90505
School District Details
- Torrance Unified School District
- Per-Pupil Spending: $8,040
- Graduation Rate: 95.1%
- Dropout Rate: 0.9%
- Students Per Teacher: 25.0
- Enrolled Students: 24,485
Faculty Details and Student Enrollment
Students and Faculty
- Total Students Enrolled: 2,234
- Total Full Time "Equivalent" Teachers: 88.6
- Average Student-To-Teacher Ratio: 25.2
Students Gender Breakdown
- Males: 1,126 (50.4%)
- Females: 1,108 (49.6%)
Free Lunch Student Eligibility Breakdown
- Eligible for Reduced Lunch: 72 (3.2%)
- Eligible for Free Lunch: 110 (4.9%)
- Eligible for Either Reduced or Free Lunch: 182 (8.1%)
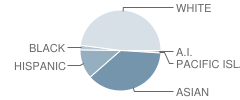
Student Enrollment Distribution by Race / Ethnicity

| Number | Percent | |
|---|---|---|
| American Indian | 18 | 0.8% |
| Black | 42 | 1.9% |
| Asian | 818 | 36.6% |
| Hispanic | 258 | 11.5% |
| White | 1,043 | 46.7% |
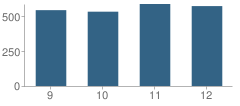
Number of Students Per Grade

| Number | Percent | |
|---|---|---|
| 9th Grade | 543 | 24.3% |
| 10th Grade | 532 | 23.8% |
| 11th Grade | 587 | 26.3% |
| 12th Grade | 572 | 25.6% |
Graduates Information (2010)
Graduation Rate
School:
98.6%
District:
96.2%
State:
78.6%
Teacher Education Background (2009)
Percent With Ph.D.
School:
2.8%
District:
22.9%
Percent With Master's Degree
School:
20.6%
District:
22.9%
Percent With Bachelor's Degree
School:
3.7%
District:
5.7%
Teacher Credentials & Experience (2009)
Percent of Teachers With Emergency Credentials: 2.1%
Percent of Teachers With Credentials: 96.9%
Number of Certificated Staff: 107.0
Average Number of Years of Teacher Experience: 11.8
Average Age
School:
40.9
District:
45.1
Source: CA Department of Education, Source: NCES 2009-2010
School Ratings and Reviews
Be The First To Review South High School!
Sponsored Links
Test Scores and Performance Information
Overall School Rating
How is this determined?
The overall school rating shows that South High School performed on average better than many other schools across the state on CST state exams in the following subjects:
- CST Algebra I
- CST Algebra II
- CST Biology
- CST Chemistry
- CST Earth Science
- CST English-Language Arts
- CST Geometry
- CST Physics
- CST Science
- CST Summative High School Math
- CST U.S. History
- CST World History
AYP Results (2010)
Overall AYP Met: Yes
ELA AYP Met: Yes
Math AYP Met: Yes
ACT Exam Results (2009)
Percent of Students Taking ACT Exam: 24.8%
Average Combined Score: 25.0
Percent Scoring At or Above 21: 83.3%
SAT Exam Results (2009)
Percent of Students Taking SAT Exam: 59.8%
Average Combined Score: 1,663.0
Critical Reading Average: 538.8
Math Average: 581.6
Writing Average: 542.6
Percent Scoring At or Above 1500: 70.9%
CST - Test Proficiency by Grade and Subject
Grade 9 - % of students at or above proficiency
| School | District | State | |
|---|---|---|---|
| CST Algebra I Test | |||
| 2010 | 39.0% | 27.0% | 22.0% |
| 2009 | 18.0% | 20.0% | 21.0% |
| 2008 | 12.0% | 11.0% | 18.0% |
| CST Algebra II Test | |||
| 2010 | 80.0% | 83.0% | 69.0% |
| 2009 | 81.0% | 79.0% | 65.0% |
| 2008 | 80.0% | 81.0% | 66.0% |
| CST Biology Test | |||
| 2010 | 75.0% | 82.0% | 55.0% |
| 2009 | 83.0% | 80.0% | 51.0% |
| 2008 | 74.0% | 76.0% | 52.0% |
| CST Chemistry Test | |||
| 2010 | 91.0% | 91.0% | 49.0% |
| 2009 | 85.0% | 88.0% | 44.0% |
| 2008 | 71.0% | 79.0% | 44.0% |
| CST Earth Science Test | |||
| 2010 | 33.0% | 42.0% | 35.0% |
| 2009 | 32.0% | 38.0% | 29.0% |
| 2008 | 23.0% | 37.0% | 31.0% |
| CST English-Language Arts Test | |||
| 2010 | 80.0% | 74.0% | 54.0% |
| 2009 | 79.0% | 74.0% | 50.0% |
| 2008 | 72.0% | 70.0% | 49.0% |
| CST Geometry Test | |||
| 2010 | 37.0% | 46.0% | 46.0% |
| 2009 | 37.0% | 44.0% | 47.0% |
| 2008 | 34.0% | 40.0% | 43.0% |
Grade 10 - % of students at or above proficiency
| School | District | State | |
|---|---|---|---|
| CST Algebra I Test | |||
| 2010 | 12.0% | 13.0% | 12.0% |
| 2009 | 12.0% | 7.0% | 11.0% |
| 2008 | 8.0% | 7.0% | 9.0% |
| CST Algebra II Test | |||
| 2010 | 33.0% | 41.0% | 40.0% |
| 2009 | 34.0% | 36.0% | 37.0% |
| 2008 | 43.0% | 34.0% | 36.0% |
| CST Biology Test | |||
| 2010 | 47.0% | 50.0% | 38.0% |
| 2009 | 38.0% | 45.0% | 34.0% |
| 2008 | 47.0% | 40.0% | 35.0% |
| CST Chemistry Test | |||
| 2010 | 56.0% | 65.0% | 47.0% |
| 2009 | 60.0% | 65.0% | 44.0% |
| 2008 | 61.0% | 59.0% | 41.0% |
| CST Earth Science Test | |||
| 2010 | 19.0% | 38.0% | 29.0% |
| 2009 | 46.0% | 40.0% | 23.0% |
| 2008 | 42.0% | 37.0% | 23.0% |
| CST English-Language Arts Test | |||
| 2010 | 72.0% | 65.0% | 45.0% |
| 2009 | 66.0% | 61.0% | 44.0% |
| 2008 | 65.0% | 57.0% | 41.0% |
| CST Geometry Test | |||
| 2010 | 5.0% | 19.0% | 14.0% |
| 2009 | 16.0% | 12.0% | 14.0% |
| 2008 | 10.0% | 11.0% | 12.0% |
| CST Science Test | |||
| 2010 | 69.0% | 68.0% | 46.0% |
| 2009 | 66.0% | 65.0% | 44.0% |
| 2008 | 66.0% | 59.0% | 40.0% |
| CST Summative High School Math Test | |||
| 2010 | 83.0% | 83.0% | 75.0% |
| 2009 | 84.0% | 81.0% | 71.0% |
| 2008 | 78.0% | 76.0% | 68.0% |
| CST World History Test | |||
| 2010 | 66.0% | 61.0% | 42.0% |
| 2009 | 66.0% | 57.0% | 38.0% |
| 2008 | 60.0% | 50.0% | 33.0% |
Grade 11 - % of students at or above proficiency
| School | District | State | |
|---|---|---|---|
| CST Algebra I Test | |||
| 2010 | 8.0% | 5.0% | 8.0% |
| 2009 | - | - | - |
| 2008 | 3.0% | 3.0% | 5.0% |
| CST Algebra II Test | |||
| 2010 | 10.0% | 12.0% | 14.0% |
| 2009 | 15.0% | 12.0% | 12.0% |
| 2008 | 11.0% | 8.0% | 11.0% |
| CST Biology Test | |||
| 2010 | 69.0% | 65.0% | 46.0% |
| 2009 | 67.0% | 61.0% | 41.0% |
| 2008 | 64.0% | 61.0% | 39.0% |
| CST Chemistry Test | |||
| 2010 | 33.0% | 44.0% | 30.0% |
| 2009 | 44.0% | 42.0% | 27.0% |
| 2008 | 46.0% | 43.0% | 25.0% |
| CST Earth Science Test | |||
| 2010 | 58.0% | 62.0% | 32.0% |
| 2009 | 59.0% | 54.0% | 26.0% |
| 2008 | 64.0% | 58.0% | 28.0% |
| CST English-Language Arts Test | |||
| 2010 | 59.0% | 55.0% | 42.0% |
| 2009 | 66.0% | 57.0% | 40.0% |
| 2008 | 63.0% | 54.0% | 37.0% |
| CST Geometry Test | |||
| 2010 | 12.0% | 11.0% | 6.0% |
| 2009 | 12.0% | 9.0% | 7.0% |
| 2008 | 2.0% | 2.0% | 6.0% |
| CST Physics Test | |||
| 2010 | 66.0% | 64.0% | 53.0% |
| 2009 | 67.0% | 64.0% | 50.0% |
| 2008 | 87.0% | 71.0% | 47.0% |
| CST Summative High School Math Test | |||
| 2010 | 51.0% | 48.0% | 50.0% |
| 2009 | 57.0% | 45.0% | 47.0% |
| 2008 | 61.0% | 49.0% | 43.0% |
| CST U.S. History Test | |||
| 2010 | 65.0% | 58.0% | 45.0% |
| 2009 | 70.0% | 58.0% | 44.0% |
| 2008 | 60.0% | 51.0% | 38.0% |
| CST World History Test | |||
| 2010 | 39.0% | 35.0% | 15.0% |
| 2009 | 36.0% | 29.0% | 11.0% |
| 2008 | 30.0% | 24.0% | 9.0% |
End of Course - % of students at or above proficiency
| School | District | State | |
|---|---|---|---|
| CST Algebra I Test | |||
| 2010 | 31.0% | 41.0% | 31.0% |
| 2009 | 15.0% | 36.0% | 28.0% |
| 2008 | 10.0% | 33.0% | 25.0% |
| CST Algebra II Test | |||
| 2010 | 37.0% | 40.0% | 31.0% |
| 2009 | 41.0% | 37.0% | 28.0% |
| 2008 | 42.0% | 33.0% | 27.0% |
| CST Biology Test | |||
| 2010 | 66.0% | 65.0% | 46.0% |
| 2009 | 65.0% | 60.0% | 42.0% |
| 2008 | 63.0% | 57.0% | 42.0% |
| CST Chemistry Test | |||
| 2010 | 54.0% | 58.0% | 38.0% |
| 2009 | 58.0% | 58.0% | 36.0% |
| 2008 | 57.0% | 54.0% | 32.0% |
| CST Earth Science Test | |||
| 2010 | 41.0% | 47.0% | 33.0% |
| 2009 | 42.0% | 41.0% | 28.0% |
| 2008 | 36.0% | 41.0% | 28.0% |
| CST Geometry Test | |||
| 2010 | 24.0% | 40.0% | 27.0% |
| 2009 | 28.0% | 38.0% | 26.0% |
| 2008 | 22.0% | 34.0% | 24.0% |
| CST Physics Test | |||
| 2010 | 66.0% | 66.0% | 49.0% |
| 2009 | 70.0% | 66.0% | 46.0% |
| 2008 | 87.0% | 71.0% | 43.0% |
| CST Summative High School Math Test | |||
| 2010 | 60.0% | 54.0% | 54.0% |
| 2009 | 65.0% | 52.0% | 50.0% |
| 2008 | 66.0% | 55.0% | 47.0% |
| CST World History Test | |||
| 2010 | 65.0% | 61.0% | 41.0% |
| 2009 | 65.0% | 57.0% | 38.0% |
| 2008 | 58.0% | 49.0% | 33.0% |
Source: CA Department of Education 2009-2010
School Map and Similar Schools Nearby
Click to Activate Map of Nearby School Campuses
Private
Public
This School
Similar Schools Nearby
| Palos Verdes Peninsula High School 9-12 | 2,337 Students | 2.1 miles away | ![]() 5 out of 5 | |
| West High School 9-12 | 2,076 Students | 2.5 miles away | Not Yet Rated | |
| Redondo High School 9-12 | 2,560 Students | 2.6 miles away | Not Yet Rated | |
| Torrance High School 9-12 | 2,180 Students | 2.9 miles away | ![]() 2 out of 5 | |
| Nathaniel Narbonne High School 9-12 | 3,387 Students | 3.4 miles away | ![]() 4.5 out of 5 | |
| Palos Verdes High School 9-12 | 1,839 Students | 3.7 miles away | Not Yet Rated | |
| North High School 9-12 | 2,229 Students | 4.2 miles away | Not Yet Rated | |
| Mira Costa High School 9-12 | 2,424 Students | 4.5 miles away | Not Yet Rated | |
| Harbor Teacher Preparation Academy 9-12 | 362 Students | 5.0 miles away | ![]() 5 out of 5 | |
| Carson High School 9-12 | 3,460 Students | 5.2 miles away | Not Yet Rated | |
Compare This School To Nearby Schools ->
School Community Forum

Join a discussion about South High School and talk to others in the community including students, parents, teachers, and administrators.
Popular Discussion Topics
- Admissions and Registration Questions (e.g. Dress Code and Discipline Policy)
- School Calendar and Upcoming Events (e.g. Graduation)
- After School Programs, Extracurricular Activities, and Athletics (e.g. Football)
- News and Announcements (e.g. Yearbook and Class Supply List Details)
- Graduate and Alumni Events (e.g. Organizing Class Reunions)
Navigation
Can't Find What You Are Looking For?
Rankings
Nearby Cities
Sponsored Links
K-12 Articles
Democracy in Action
There is still over a year until the general election, but the election cycle has been in full...
What to Do when Your Child Hates School
All kids grumble about going to school at one time or another. This is perfectly normal, but what...
All About Backpacks
Your child riffles through his backpack to find homework assignments, his MP3 player, lunch money...


