Sierra Vista Elementary School
Rating
Not Available
Not Available

5 out of 5 | 2 Reviews
Find Old Friends From Sierra Vista Elementary School
Use the form below to search for alumni from Sierra Vista Elementary School.
School Description
School Summary and Highlights
- Enrolls 396 elementary school students from grades KG-6
- Ranks 2579th out of 5,423 elementary schools in CA.
- 2010 Overall School AYP Met Status: Yes
Additional Contact Information
- Mailing Address: 301 Bel Air Dr., Vacaville, CA 95687
School Operational Details
- Title I Eligible
School District Details
- Vacaville Unified School District
- Per-Pupil Spending: $7,885
- Graduation Rate: 67.7%
- Dropout Rate: 4.0%
- Students Per Teacher: 22.0
- Enrolled Students: 13,050
Faculty Details and Student Enrollment
Students and Faculty
- Total Students Enrolled: 396
- Total Full Time "Equivalent" Teachers: 21.1
- Average Student-To-Teacher Ratio: 18.8
Students Gender Breakdown
- Males: 209 (52.8%)
- Females: 187 (47.2%)
Free Lunch Student Eligibility Breakdown
- Eligible for Reduced Lunch: 46 (11.6%)
- Eligible for Free Lunch: 125 (31.6%)
- Eligible for Either Reduced or Free Lunch: 171 (43.2%)
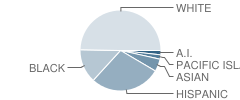
Student Enrollment Distribution by Race / Ethnicity
| Number | Percent | |
|---|---|---|
| American Indian | 9 | 2.3% |
| Black | 52 | 13.1% |
| Asian | 21 | 5.3% |
| Hispanic | 106 | 26.8% |
| White | 184 | 46.5% |
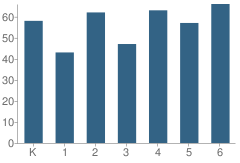
Number of Students Per Grade
| Number | Percent | |
|---|---|---|
| Kindergarten | 58 | 14.6% |
| 1st Grade | 43 | 10.9% |
| 2nd Grade | 62 | 15.7% |
| 3rd Grade | 47 | 11.9% |
| 4th Grade | 63 | 15.9% |
| 5th Grade | 57 | 14.4% |
| 6th Grade | 66 | 16.7% |
Teacher Education Background (2009)
Percent With Master's Degree
School:
18.2%
District:
13.5%
Percent With Bachelor's Degree: 3.0%
Teacher Credentials & Experience (2009)
Percent of Teachers With Credentials: 100.0%
Number of Certificated Staff: 33.0
Average Number of Years of Teacher Experience: 18.7
Average Age
School:
48.1
District:
49.0
Source: CA Department of Education, Source: NCES 2009-2010
School Ratings and Reviews
Overall Rating: 5

5 out of 5 | 2 Reviews
The Overall Rating is the school's average rating from parents, students, school faculty and staff. The highest rating is five apples and the lowest is one apple.
Share Your Review About This School
2 reviews for Sierra Vista Elementary School
- Reviewed by Former Student on April 16, 2009
- Rating:
 (5 / 5) Flag as inappropriate
 - this school is literly the best ever better than fairmount cooper
- Reviewed by Parent/Guardian on March 09, 2009
- Rating: (5 / 5) Flag as inappropriate
- Love this school and it's concern and care for my childs well being as well as her education!
School Map and Similar Schools Nearby
Click to Activate Map of Nearby School Campuses
Private
Public
This School
Similar Schools Nearby
| Cambridge Elementary School KG-6 | 535 Students | 0.4 miles away | Not Yet Rated | |
| Foxboro Elementary School KG-6 | 721 Students | 0.9 miles away |  5 out of 5 | |
| Jean Callison Elementary School KG-6 | 803 Students | 0.9 miles away | Not Yet Rated | |
| Eugene Padan Elementary School KG-6 | 716 Students | 1.5 miles away | Not Yet Rated | |
| Cooper Elementary School KG-6 | 916 Students | 1.5 miles away | Not Yet Rated | |
| Edwin Markham Elementary School KG-6 | 881 Students | 2.6 miles away | 5 out of 5 | |
| Alamo Elementary School KG-6 | 595 Students | 2.7 miles away | Not Yet Rated | |
| Hemlock Elementary School KG-6 | 362 Students | 3.1 miles away |  4 out of 5 | |
| Browns Valley Elementary School KG-6 | 937 Students | 3.5 miles away | Not Yet Rated | |
| Orchard Elementary School KG-6 | 414 Students | 3.8 miles away | 5 out of 5 | |
Compare This School To Nearby Schools ->
School Community Forum

Join a discussion about Sierra Vista Elementary School and talk to others in the community including students, parents, teachers, and administrators.
Popular Discussion Topics
- Admissions and Registration Questions (e.g. Dress Code and Discipline Policy)
- School Calendar and Upcoming Events (e.g. Graduation)
- After School Programs, Extracurricular Activities, and Athletics (e.g. Football)
- News and Announcements (e.g. Yearbook and Class Supply List Details)
- Graduate and Alumni Events (e.g. Organizing Class Reunions)
Navigation
Can't Find What You Are Looking For?
Rankings
Nearby Cities
Sponsored Links
K-12 Articles

What to Do when Your Child Hates School
All kids grumble about going to school at one time or another. This is perfectly normal, but what...
All kids grumble about going to school at one time or another. This is perfectly normal, but what...

Summer Reading
In 1998, a book was published in the US that turned a hatred of reading to love. "Harry Potter and...
In 1998, a book was published in the US that turned a hatred of reading to love. "Harry Potter and...

Does Your Child's Teacher Make a Difference
School improvement is always in the news. Teachers demand smaller class sizes. The government calls...
School improvement is always in the news. Teachers demand smaller class sizes. The government calls...