Jesse M. Bethel High School

4 out of 5 | 1 Review
Find Old Friends From Jesse M. Bethel High School
Use the form below to search for alumni from Jesse M. Bethel High School.
School Description
School Summary and Highlights
- Enrolls 1,494 high school students from grades 9-12
- Ranks 559th out of 1,197 high schools in CA.
- 2010 Overall School AYP Met Status: No
Additional Contact Information
- Mailing Address: 1800 Ascot Pkwy., Vallejo, CA 94591
School District Details
- Vallejo City Unified School District
- Per-Pupil Spending: $8,770
- Graduation Rate: 50.8%
- Dropout Rate: 11.4%
- Students Per Teacher: 21.9
- Enrolled Students: 16,145
Faculty Details and Student Enrollment
Students and Faculty
- Total Students Enrolled: 1,494
- Total Full Time "Equivalent" Teachers: 61.0
- Average Student-To-Teacher Ratio: 24.5
Students Gender Breakdown
- Males: 789 (52.8%)
- Females: 705 (47.2%)
Free Lunch Student Eligibility Breakdown
- Eligible for Reduced Lunch: 102 (6.8%)
- Eligible for Free Lunch: 482 (32.3%)
- Eligible for Either Reduced or Free Lunch: 584 (39.1%)
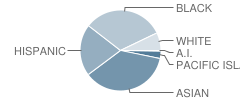
Student Enrollment Distribution by Race / Ethnicity

| Number | Percent | |
|---|---|---|
| American Indian | 6 | 0.4% |
| Black | 470 | 31.5% |
| Asian | 531 | 35.5% |
| Hispanic | 301 | 20.1% |
| White | 105 | 7.0% |
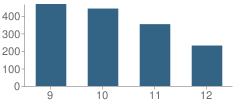
Number of Students Per Grade

| Number | Percent | |
|---|---|---|
| 9th Grade | 468 | 31.3% |
| 10th Grade | 442 | 29.6% |
| 11th Grade | 353 | 23.6% |
| 12th Grade | 231 | 15.5% |
Graduates Information (2010)
Graduation Rate
School:
66.0%
District:
57.7%
State:
78.6%
Teacher Education Background (2009)
Percent With Master's Degree
School:
14.9%
District:
21.1%
Percent With Bachelor's Degree
School:
16.2%
District:
3.3%
Teacher Credentials & Experience (2009)
Percent of Teachers With Credentials: 81.5%
Number of Certificated Staff: 74.0
Average Number of Years of Teacher Experience: 14.1
Average Age
School:
47.5
District:
51.7
Source: CA Department of Education, Source: NCES 2009-2010
Sponsored Links
Test Scores and Performance Information
Overall School Rating
How is this determined?
The overall school rating shows that Jesse M. Bethel High School performed on average about the same as other schools across the state on CST state exams in the following subjects:
- CST Algebra I
- CST Algebra II
- CST Biology
- CST Chemistry
- CST English-Language Arts
- CST General Mathematics
- CST Geometry
- CST Integrated/Coordinated Science
- CST Physics
- CST Science
- CST Summative High School Math
- CST U.S. History
- CST World History
AYP Results (2010)
Overall AYP Met: No
ELA AYP Met: No
Math AYP Met: No
ACT Exam Results (2009)
Percent of Students Taking ACT Exam: 8.3%
Average Combined Score: 20.0
Percent Scoring At or Above 21: 46.2%
SAT Exam Results (2009)
Percent of Students Taking SAT Exam: 23.5%
Average Combined Score: 1,384.2
Critical Reading Average: 457.2
Math Average: 470.3
Writing Average: 456.8
Percent Scoring At or Above 1500: 33.8%
CST - Test Proficiency by Grade and Subject
Grade 9 - % of students at or above proficiency
| School | District | State | |
|---|---|---|---|
| CST Algebra I Test | |||
| 2010 | 22.0% | 11.0% | 22.0% |
| 2009 | 22.0% | 14.0% | 21.0% |
| 2008 | 12.0% | 8.0% | 18.0% |
| CST Biology Test | |||
| 2010 | 27.0% | 40.0% | 55.0% |
| 2009 | - | - | - |
| 2008 | 10.0% | 22.0% | 52.0% |
| CST English-Language Arts Test | |||
| 2010 | 50.0% | 48.0% | 54.0% |
| 2009 | 46.0% | 38.0% | 50.0% |
| 2008 | 43.0% | 38.0% | 49.0% |
| CST General Mathematics Test | |||
| 2010 | 28.0% | 19.0% | 17.0% |
| CST Geometry Test | |||
| 2010 | 47.0% | 30.0% | 46.0% |
| 2009 | 52.0% | 35.0% | 47.0% |
| 2008 | 18.0% | 15.0% | 43.0% |
| CST Integrated/Coordinated Science Test | |||
| 2009 | 17.0% | 15.0% | 15.0% |
| 2008 | 15.0% | 14.0% | 5.0% |
| CST World History Test | |||
| 2008 | 14.0% | 7.0% | 36.0% |
Grade 10 - % of students at or above proficiency
| School | District | State | |
|---|---|---|---|
| CST Algebra I Test | |||
| 2010 | 9.0% | 7.0% | 12.0% |
| 2009 | 16.0% | 10.0% | 11.0% |
| 2008 | 2.0% | 7.0% | 9.0% |
| CST Algebra II Test | |||
| 2010 | 53.0% | 43.0% | 40.0% |
| 2009 | 35.0% | 31.0% | 37.0% |
| 2008 | 32.0% | 28.0% | 36.0% |
| CST Biology Test | |||
| 2010 | 30.0% | 26.0% | 38.0% |
| 2009 | 25.0% | 20.0% | 34.0% |
| 2008 | 26.0% | 26.0% | 35.0% |
| CST English-Language Arts Test | |||
| 2010 | 42.0% | 33.0% | 45.0% |
| 2009 | 42.0% | 32.0% | 44.0% |
| 2008 | 33.0% | 30.0% | 41.0% |
| CST Geometry Test | |||
| 2010 | 28.0% | 13.0% | 14.0% |
| 2009 | 8.0% | 6.0% | 14.0% |
| 2008 | 8.0% | 7.0% | 12.0% |
| CST Science Test | |||
| 2010 | 37.0% | 33.0% | 46.0% |
| 2009 | 37.0% | 28.0% | 44.0% |
| 2008 | 28.0% | 27.0% | 40.0% |
| CST World History Test | |||
| 2010 | 27.0% | 24.0% | 42.0% |
| 2009 | 39.0% | 23.0% | 38.0% |
| 2008 | 28.0% | 21.0% | 33.0% |
| CST Integrated/Coordinated Science Test | |||
| 2008 | 4.0% | 3.0% | 7.0% |
Grade 11 - % of students at or above proficiency
| School | District | State | |
|---|---|---|---|
| CST Algebra I Test | |||
| 2010 | 18.0% | 9.0% | 8.0% |
| 2009 | 17.0% | 17.0% | 8.0% |
| CST Algebra II Test | |||
| 2010 | 27.0% | 14.0% | 14.0% |
| 2009 | 20.0% | 21.0% | 12.0% |
| 2008 | 6.0% | 11.0% | 11.0% |
| CST Chemistry Test | |||
| 2010 | 22.0% | 19.0% | 30.0% |
| 2009 | 34.0% | 23.0% | 27.0% |
| 2008 | 11.0% | 12.0% | 25.0% |
| CST English-Language Arts Test | |||
| 2010 | 43.0% | 34.0% | 42.0% |
| 2009 | 36.0% | 33.0% | 40.0% |
| 2008 | 36.0% | 31.0% | 37.0% |
| CST Geometry Test | |||
| 2010 | 7.0% | 9.0% | 6.0% |
| 2009 | - | - | - |
| 2008 | 10.0% | 6.0% | 6.0% |
| CST Integrated/Coordinated Science Test | |||
| 2010 | 7.0% | 4.0% | 8.0% |
| 2009 | 2.0% | 2.0% | 11.0% |
| 2008 | 5.0% | 4.0% | 10.0% |
| CST Physics Test | |||
| 2010 | 59.0% | 25.0% | 53.0% |
| 2009 | 19.0% | 18.0% | 50.0% |
| 2008 | 50.0% | 16.0% | 47.0% |
| CST Summative High School Math Test | |||
| 2010 | 54.0% | 38.0% | 50.0% |
| 2009 | 23.0% | 24.0% | 47.0% |
| 2008 | 12.0% | 18.0% | 43.0% |
| CST U.S. History Test | |||
| 2010 | 50.0% | 37.0% | 45.0% |
| 2009 | 35.0% | 34.0% | 44.0% |
| 2008 | 23.0% | 28.0% | 38.0% |
| CST Biology Test | |||
| 2009 | 4.0% | 27.0% | 41.0% |
| 2008 | 50.0% | 36.0% | 39.0% |
End of Course - % of students at or above proficiency
| School | District | State | |
|---|---|---|---|
| CST Algebra I Test | |||
| 2010 | 15.0% | 18.0% | 31.0% |
| 2009 | 20.0% | 18.0% | 28.0% |
| 2008 | 9.0% | 17.0% | 25.0% |
| CST Algebra II Test | |||
| 2010 | 45.0% | 28.0% | 31.0% |
| 2009 | 29.0% | 24.0% | 28.0% |
| 2008 | 18.0% | 18.0% | 27.0% |
| CST Biology Test | |||
| 2010 | 30.0% | 32.0% | 46.0% |
| 2009 | 23.0% | 25.0% | 42.0% |
| 2008 | 26.0% | 26.0% | 42.0% |
| CST Chemistry Test | |||
| 2010 | 24.0% | 21.0% | 38.0% |
| 2009 | 33.0% | 20.0% | 36.0% |
| 2008 | 10.0% | 12.0% | 32.0% |
| CST General Mathematics Test | |||
| 2010 | 28.0% | 16.0% | 27.0% |
| CST Geometry Test | |||
| 2010 | 33.0% | 19.0% | 27.0% |
| 2009 | 32.0% | 15.0% | 26.0% |
| 2008 | 11.0% | 10.0% | 24.0% |
| CST Integrated/Coordinated Science Test | |||
| 2010 | 7.0% | 15.0% | 16.0% |
| 2009 | 17.0% | 14.0% | 13.0% |
| 2008 | 14.0% | 4.0% | 11.0% |
| CST Physics Test | |||
| 2010 | 61.0% | 26.0% | 49.0% |
| 2009 | 19.0% | 13.0% | 46.0% |
| 2008 | 50.0% | 15.0% | 43.0% |
| CST Summative High School Math Test | |||
| 2010 | 56.0% | 38.0% | 54.0% |
| 2009 | 24.0% | 23.0% | 50.0% |
| 2008 | 16.0% | 19.0% | 47.0% |
| CST World History Test | |||
| 2010 | 26.0% | 24.0% | 41.0% |
| 2009 | 38.0% | 21.0% | 38.0% |
| 2008 | 26.0% | 19.0% | 33.0% |
Source: CA Department of Education 2009-2010
School Map and Similar Schools Nearby
Click to Activate Map of Nearby School Campuses
Private
Public
This School
Similar Schools Nearby
| Hogan High School 9-12 | 1,361 Students | 1.3 miles away | ![]() 3.5 out of 5 | |
| Vallejo High School 9-12 | 1,666 Students | 2.3 miles away | ![]() 3 out of 5 | |
| Benicia High School 9-12 | 1,671 Students | 4.0 miles away | Not Yet Rated | |
| John Swett High School 9-12 | 524 Students | 4.5 miles away | Not Yet Rated | |
| Martinez Junior High School 6-8 | 918 Students | 8.0 miles away | Not Yet Rated | |
| Hercules High School 9-12 | 1,008 Students | 8.6 miles away | ![]() 3 out of 5 | |
| Alhambra High School 9-12 | 1,280 Students | 8.7 miles away | ![]() 5 out of 5 | |
| Pinole Valley High School 9-12 | 1,622 Students | 9.9 miles away | Not Yet Rated | |
| Crespi Junior High School 7-8 | 581 Students | 10.8 miles away | Not Yet Rated | |
| De Anza High School 9-12 | 907 Students | 11.3 miles away | ![]() 5 out of 5 | |
Compare This School To Nearby Schools ->
School Community Forum

Join a discussion about Jesse M. Bethel High School and talk to others in the community including students, parents, teachers, and administrators.
Popular Discussion Topics
- Admissions and Registration Questions (e.g. Dress Code and Discipline Policy)
- School Calendar and Upcoming Events (e.g. Graduation)
- After School Programs, Extracurricular Activities, and Athletics (e.g. Football)
- News and Announcements (e.g. Yearbook and Class Supply List Details)
- Graduate and Alumni Events (e.g. Organizing Class Reunions)
Navigation
Can't Find What You Are Looking For?
Rankings
Nearby Cities
Sponsored Links
K-12 Articles
Imho
I was watching Headline News's news ticker when I read something that made me LOL. The ticker said...
Transform Your Middle School Slacker into a Scholar
All children need motivation to learn. Have your child's grades decreased since he started middle...
Keep Kids Learning All Summer
Early in the 20th century schools in urban districts operated all year `round. However, in rural...


(4 / 5) 

