Foothill Technology High School

No Reviews Yet
Find Old Friends From Foothill Technology High School
Use the form below to search for alumni from Foothill Technology High School.
School Description
School Summary and Highlights
- Enrolls 921 high school students from grades 9-12
- Ranks 70th out of 1,197 high schools in CA.
- 2010 Overall School AYP Met Status: Yes
- National Blue Ribbon Schools Award 2006

Additional Contact Information
- Mailing Address: 100 Day Rd., Ventura, CA 93003
School District Details
- Ventura Unified School District
- Per-Pupil Spending: $8,755
- Graduation Rate: 74.9%
- Dropout Rate: 2.4%
- Students Per Teacher: 22.7
- Enrolled Students: 17,484
Faculty Details and Student Enrollment
Students and Faculty
- Total Students Enrolled: 921
- Total Full Time "Equivalent" Teachers: 34.7
- Average Student-To-Teacher Ratio: 26.5
Students Gender Breakdown
- Males: 437 (47.4%)
- Females: 484 (52.6%)
Free Lunch Student Eligibility Breakdown
- Eligible for Reduced Lunch: 85 (9.2%)
- Eligible for Free Lunch: 119 (12.9%)
- Eligible for Either Reduced or Free Lunch: 204 (22.1%)
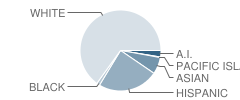
Student Enrollment Distribution by Race / Ethnicity

| Number | Percent | |
|---|---|---|
| American Indian | 24 | 2.6% |
| Black | 12 | 1.3% |
| Asian | 61 | 6.6% |
| Hispanic | 217 | 23.6% |
| White | 583 | 63.3% |
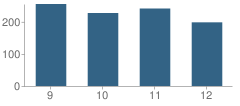
Number of Students Per Grade

| Number | Percent | |
|---|---|---|
| 9th Grade | 255 | 27.7% |
| 10th Grade | 227 | 24.6% |
| 11th Grade | 241 | 26.2% |
| 12th Grade | 198 | 21.5% |
Graduates Information (2010)
Graduation Rate
School:
99.1%
District:
88.5%
State:
78.6%
Teacher Education Background (2009)
Percent With Master's Degree
School:
10.0%
District:
5.8%
Percent With Bachelor's Degree
School:
12.5%
District:
13.5%
Teacher Credentials & Experience (2009)
Percent of Teachers With Emergency Credentials: 6.3%
Percent of Teachers With Credentials: 100.0%
Number of Certificated Staff: 40.0
Average Number of Years of Teacher Experience: 9.3
Average Age
School:
37.0
District:
46.4
Source: CA Department of Education, Source: NCES 2009-2010
School Ratings and Reviews
Be The First To Review Foothill Technology High School!
Sponsored Links
Test Scores and Performance Information
Overall School Rating
How is this determined?
The overall school rating shows that Foothill Technology High School performed on average much better than most other schools across the state on CST state exams in the following subjects:
- CST Algebra I
- CST Algebra II
- CST Biology
- CST Chemistry
- CST English-Language Arts
- CST General Mathematics
- CST Geometry
- CST Physics
- CST Science
- CST Summative High School Math
- CST U.S. History
- CST World History
AYP Results (2010)
Overall AYP Met: Yes
ELA AYP Met: Yes
Math AYP Met: Yes
ACT Exam Results (2009)
Percent of Students Taking ACT Exam: 43.0%
Average Combined Score: 25.2
Percent Scoring At or Above 21: 87.9%
SAT Exam Results (2009)
Percent of Students Taking SAT Exam: 67.4%
Average Combined Score: 1,676.7
Critical Reading Average: 565.9
Math Average: 564.6
Writing Average: 546.2
Percent Scoring At or Above 1500: 75.5%
CST - Test Proficiency by Grade and Subject
Grade 9 - % of students at or above proficiency
| School | District | State | |
|---|---|---|---|
| CST Algebra I Test | |||
| 2010 | 33.0% | 34.0% | 22.0% |
| 2009 | 42.0% | 37.0% | 21.0% |
| 2008 | 38.0% | 30.0% | 18.0% |
| CST Biology Test | |||
| 2010 | 74.0% | 69.0% | 55.0% |
| 2009 | 79.0% | 65.0% | 51.0% |
| 2008 | 80.0% | 66.0% | 52.0% |
| CST English-Language Arts Test | |||
| 2010 | 89.0% | 68.0% | 54.0% |
| 2009 | 89.0% | 67.0% | 50.0% |
| 2008 | 89.0% | 62.0% | 49.0% |
| CST Geometry Test | |||
| 2010 | 71.0% | 67.0% | 46.0% |
| 2009 | 75.0% | 67.0% | 47.0% |
| 2008 | 74.0% | 65.0% | 43.0% |
| CST General Mathematics Test | |||
| 2008 | 11.0% | 17.0% | 18.0% |
Grade 10 - % of students at or above proficiency
| School | District | State | |
|---|---|---|---|
| CST Algebra I Test | |||
| 2010 | 29.0% | 10.0% | 12.0% |
| 2009 | 18.0% | 9.0% | 11.0% |
| 2008 | 28.0% | 11.0% | 9.0% |
| CST Algebra II Test | |||
| 2010 | 69.0% | 50.0% | 40.0% |
| 2009 | 73.0% | 52.0% | 37.0% |
| 2008 | 65.0% | 54.0% | 36.0% |
| CST Chemistry Test | |||
| 2010 | 58.0% | 40.0% | 47.0% |
| 2009 | 53.0% | 44.0% | 44.0% |
| 2008 | 52.0% | 43.0% | 41.0% |
| CST English-Language Arts Test | |||
| 2010 | 86.0% | 59.0% | 45.0% |
| 2009 | 86.0% | 55.0% | 44.0% |
| 2008 | 84.0% | 55.0% | 41.0% |
| CST Geometry Test | |||
| 2010 | 51.0% | 23.0% | 14.0% |
| 2009 | 59.0% | 18.0% | 14.0% |
| 2008 | 40.0% | 18.0% | 12.0% |
| CST Physics Test | |||
| 2010 | 26.0% | 19.0% | 44.0% |
| 2009 | 12.0% | 10.0% | 40.0% |
| 2008 | 6.0% | 6.0% | 36.0% |
| CST Science Test | |||
| 2010 | 84.0% | 53.0% | 46.0% |
| 2009 | 80.0% | 53.0% | 44.0% |
| 2008 | 82.0% | 48.0% | 40.0% |
| CST World History Test | |||
| 2010 | 87.0% | 55.0% | 42.0% |
| 2009 | 84.0% | 49.0% | 38.0% |
| 2008 | 80.0% | 45.0% | 33.0% |
| CST Biology Test | |||
| 2008 | 71.0% | 33.0% | 35.0% |
Grade 11 - % of students at or above proficiency
| School | District | State | |
|---|---|---|---|
| CST Algebra II Test | |||
| 2010 | 11.0% | 13.0% | 14.0% |
| 2009 | 20.0% | 12.0% | 12.0% |
| 2008 | 21.0% | 14.0% | 11.0% |
| CST Biology Test | |||
| 2010 | 92.0% | 68.0% | 46.0% |
| 2009 | 88.0% | 62.0% | 41.0% |
| 2008 | 89.0% | 56.0% | 39.0% |
| CST Chemistry Test | |||
| 2010 | 15.0% | 22.0% | 30.0% |
| 2009 | 17.0% | 19.0% | 27.0% |
| 2008 | 32.0% | 22.0% | 25.0% |
| CST English-Language Arts Test | |||
| 2010 | 84.0% | 55.0% | 42.0% |
| 2009 | 85.0% | 52.0% | 40.0% |
| 2008 | 85.0% | 51.0% | 37.0% |
| CST Geometry Test | |||
| 2010 | 19.0% | 7.0% | 6.0% |
| 2009 | - | - | - |
| 2008 | 19.0% | 4.0% | 6.0% |
| CST Physics Test | |||
| 2010 | 71.0% | 68.0% | 53.0% |
| 2009 | 77.0% | 72.0% | 50.0% |
| 2008 | 84.0% | 82.0% | 47.0% |
| CST Summative High School Math Test | |||
| 2010 | 75.0% | 60.0% | 50.0% |
| 2009 | 54.0% | 48.0% | 47.0% |
| 2008 | 65.0% | 49.0% | 43.0% |
| CST U.S. History Test | |||
| 2010 | 90.0% | 53.0% | 45.0% |
| 2009 | 91.0% | 53.0% | 44.0% |
| 2008 | 93.0% | 50.0% | 38.0% |
End of Course - % of students at or above proficiency
| School | District | State | |
|---|---|---|---|
| CST Algebra I Test | |||
| 2010 | 35.0% | 39.0% | 31.0% |
| 2009 | 38.0% | 43.0% | 28.0% |
| 2008 | 38.0% | 34.0% | 25.0% |
| CST Algebra II Test | |||
| 2010 | 44.0% | 33.0% | 31.0% |
| 2009 | 51.0% | 35.0% | 28.0% |
| 2008 | 44.0% | 35.0% | 27.0% |
| CST Biology Test | |||
| 2010 | 79.0% | 61.0% | 46.0% |
| 2009 | 80.0% | 55.0% | 42.0% |
| 2008 | 81.0% | 54.0% | 42.0% |
| CST Chemistry Test | |||
| 2010 | 54.0% | 36.0% | 38.0% |
| 2009 | 48.0% | 37.0% | 36.0% |
| 2008 | 45.0% | 34.0% | 32.0% |
| CST Geometry Test | |||
| 2010 | 61.0% | 42.0% | 27.0% |
| 2009 | 68.0% | 35.0% | 26.0% |
| 2008 | 58.0% | 34.0% | 24.0% |
| CST Physics Test | |||
| 2010 | 60.0% | 54.0% | 49.0% |
| 2009 | 62.0% | 60.0% | 46.0% |
| 2008 | 54.0% | 58.0% | 43.0% |
| CST Summative High School Math Test | |||
| 2010 | 74.0% | 60.0% | 54.0% |
| 2009 | 54.0% | 49.0% | 50.0% |
| 2008 | 66.0% | 50.0% | 47.0% |
| CST World History Test | |||
| 2010 | 87.0% | 54.0% | 41.0% |
| 2009 | 84.0% | 49.0% | 38.0% |
| 2008 | 80.0% | 43.0% | 33.0% |
| CST General Mathematics Test | |||
| 2008 | 11.0% | 35.0% | 27.0% |
Source: CA Department of Education 2009-2010
School Map and Similar Schools Nearby
Click to Activate Map of Nearby School Campuses
Private
Public
This School
Similar Schools Nearby
| Buena High School 9-12 | 2,197 Students | 0.6 miles away | ![]() 1 out of 5 | |
| Ventura High School 9-12 | 2,105 Students | 2.4 miles away | Not Yet Rated | |
| Rio Mesa High School 9-12 | 2,205 Students | 4.8 miles away | Not Yet Rated | |
| E. O. Green Junior High School 6-8 | 966 Students | 8.2 miles away | Not Yet Rated | |
| Channel Islands High School 9-12 | 2,761 Students | 8.3 miles away | Not Yet Rated | |
| Charles Blackstock Junior High School 6-8 | 1,276 Students | 8.6 miles away | ![]() 5 out of 5 | |
| Hueneme High School 9-12 | 2,191 Students | 8.7 miles away | ![]() 2.5 out of 5 | |
| Ocean View Junior High School 6-8 | 795 Students | 9.3 miles away | ![]() 5 out of 5 | |
| Santa Paula High School 9-12 | 1,524 Students | 10.5 miles away | Not Yet Rated | |
| Nordhoff High School 9-12 | 952 Students | 11.6 miles away | ![]() 5 out of 5 | |
Compare This School To Nearby Schools ->
School Community Forum

Join a discussion about Foothill Technology High School and talk to others in the community including students, parents, teachers, and administrators.
Popular Discussion Topics
- Admissions and Registration Questions (e.g. Dress Code and Discipline Policy)
- School Calendar and Upcoming Events (e.g. Graduation)
- After School Programs, Extracurricular Activities, and Athletics (e.g. Football)
- News and Announcements (e.g. Yearbook and Class Supply List Details)
- Graduate and Alumni Events (e.g. Organizing Class Reunions)
Navigation
Can't Find What You Are Looking For?
Rankings
Nearby Cities
Sponsored Links
K-12 Articles
Keep Kids Learning All Summer
Early in the 20th century schools in urban districts operated all year `round. However, in rural...
Keep Morning Stress at a Minimum: Establish a Routine
Morning! It can be a time of stress. The kids are fighting over who gets to use the bathroom first,...
It's the Most Wonderful Time of the Year!
For most of the country, school is starting up this week or later this month-at the beginning of...


