Brentwood Elementary School
Rating
Not Available
Not Available

3 out of 5 | 1 Review
Find Old Friends From Brentwood Elementary School
Use the form below to search for alumni from Brentwood Elementary School.
School Description
School Summary and Highlights
- Enrolls 934 elementary school students from grades KG-6
- Ranks 3385th out of 5,423 elementary schools in CA.
- 2010 Overall School AYP Met Status: No
- National Blue Ribbon Schools Award 2003

Additional Contact Information
- Mailing Address: 15579 Eighth St., Victorville, CA 92395
School Operational Details
- Title I Eligible
School District Details
- Victor Elementary School District
- Per-Pupil Spending: $7,219
- Students Per Teacher: 25.4
- Enrolled Students: 11,625
Faculty Details and Student Enrollment
Students and Faculty
- Total Students Enrolled: 934
- Total Full Time "Equivalent" Teachers: 39.0
- Average Student-To-Teacher Ratio: 24.0
Students Gender Breakdown
- Males: 475 (50.9%)
- Females: 459 (49.1%)
Free Lunch Student Eligibility Breakdown
- Eligible for Reduced Lunch: 83 (8.9%)
- Eligible for Free Lunch: 599 (64.1%)
- Eligible for Either Reduced or Free Lunch: 682 (73.0%)
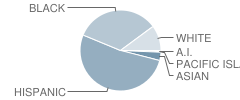
Student Enrollment Distribution by Race / Ethnicity
| Number | Percent | |
|---|---|---|
| American Indian | 5 | 0.5% |
| Black | 307 | 32.9% |
| Asian | 31 | 3.3% |
| Hispanic | 476 | 51.0% |
| White | 93 | 10.0% |
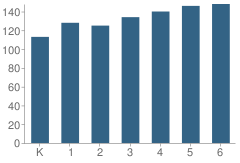
Number of Students Per Grade
| Number | Percent | |
|---|---|---|
| Kindergarten | 113 | 12.1% |
| 1st Grade | 128 | 13.7% |
| 2nd Grade | 125 | 13.4% |
| 3rd Grade | 134 | 14.3% |
| 4th Grade | 140 | 15.0% |
| 5th Grade | 146 | 15.6% |
| 6th Grade | 148 | 15.8% |
Teacher Education Background (2009)
Percent With Master's Degree
School:
29.5%
District:
41.4%
Percent With Bachelor's Degree
School:
6.8%
District:
3.4%
Teacher Credentials & Experience (2009)
Percent of Teachers With Emergency Credentials: 16.3%
Percent of Teachers With Credentials: 95.3%
Number of Certificated Staff: 44.0
Average Number of Years of Teacher Experience: 9.9
Average Age
School:
39.2
District:
45.8
Source: CA Department of Education, Source: NCES 2009-2010
School Ratings and Reviews
Overall Rating: 3

3 out of 5 | 1 Review
The Overall Rating is the school's average rating from parents, students, school faculty and staff. The highest rating is five apples and the lowest is one apple.
Share Your Review About This School
1 review for Brentwood Elementary School
- Reviewed by Parent or Guardian on May 09, 2011
- Rating:
 (3 / 5) Flag as inappropriate
 - Classroom size for both Kinder and older grades is 30 per classroom. There are lots of students who are learning English as a second Language. 7 habits Curriculum is great for the students. The teachers that my children have are great, and I am very informed and involved. The school went to a closed campus this year, and this seems to have helped to resolve some problems. Overall, Brentwood is a good place, but there is room for additional parental involvement. School is in Program Improvement due to low test scores.
School Map and Similar Schools Nearby
Click to Activate Map of Nearby School Campuses
Private
Public
This School
Similar Schools Nearby
| Village Elementary School KG-6 | 728 Students | 1.0 miles away | Not Yet Rated | |
| West Palms Conservatory School KG-6 | 732 Students | 1.4 miles away |  5 out of 5 | - |
| Challenger School of Sports and Fitness KG-6 | 1,078 Students | 1.7 miles away | 5 out of 5 | |
| Park View Elementary School KG-6 | 742 Students | 2.2 miles away | Not Yet Rated | |
| Morgan / Kincaid Preparatory School of Integrated St KG-6 | 727 Students | 2.8 miles away | Not Yet Rated | |
| Puesta Del Sol Elementary School KG-6 | 465 Students | 2.9 miles away |  4 out of 5 | |
| Vista Verde Elementary School KG-5 | 861 Students | 3.1 miles away | Not Yet Rated | |
| Desert Trails Elementary School KG-6 | 677 Students | 3.4 miles away |  2 out of 5 | |
| Donald F. Bradach Elementary School KG-8 | 684 Students | 3.4 miles away | Not Yet Rated | |
| Eagle Ranch School KG-6 | 960 Students | 3.5 miles away | Not Yet Rated | |
Compare This School To Nearby Schools ->
School Community Forum

Join a discussion about Brentwood Elementary School and talk to others in the community including students, parents, teachers, and administrators.
Popular Discussion Topics
- Admissions and Registration Questions (e.g. Dress Code and Discipline Policy)
- School Calendar and Upcoming Events (e.g. Graduation)
- After School Programs, Extracurricular Activities, and Athletics (e.g. Football)
- News and Announcements (e.g. Yearbook and Class Supply List Details)
- Graduate and Alumni Events (e.g. Organizing Class Reunions)
Navigation
Can't Find What You Are Looking For?
Rankings
Nearby Cities
Sponsored Links
K-12 Articles

The Pros and Cons of Seat Belts in School Buses
Recently the news has been full of school bus accidents where children have been seriously injured...
Recently the news has been full of school bus accidents where children have been seriously injured...

Se Hablan Otras Idiomas?
In the late 1990s, the Salem-Keizer school district in Oregon began requiring every student in its...
In the late 1990s, the Salem-Keizer school district in Oregon began requiring every student in its...

Everyone Loves Going to the Doctor and Dentist
Going to the doctor or dentist can be traumatic for children of all ages. Many adults do not...
Going to the doctor or dentist can be traumatic for children of all ages. Many adults do not...