Sunset School
Rating
Not Available
Not Available

No Reviews Yet
Find Old Friends From Sunset School
Use the form below to search for alumni from Sunset School.
School Description
School Summary and Highlights
- Enrolls 382 elementary school students from grades 5-8
- Ranks 2034th out of 2,050 middle schools in CA.
- 2010 Overall School AYP Met Status: No
Additional Contact Information
- Mailing Address: 8301 Sunset Blvd., Bakersfield, CA 93307
School Operational Details
- Title I Eligible
School District Details
- Vineland Elementary School District
- Per-Pupil Spending: $11,796
- Students Per Teacher: 23.5
- Enrolled Students: 892
Faculty Details and Student Enrollment
Students and Faculty
- Total Students Enrolled: 382
- Total Full Time "Equivalent" Teachers: 19.0
- Average Student-To-Teacher Ratio: 20.1
Students Gender Breakdown
- Males: 190 (49.7%)
- Females: 192 (50.3%)
Free Lunch Student Eligibility Breakdown
- Eligible for Reduced Lunch: 26 (6.8%)
- Eligible for Free Lunch: 348 (91.1%)
- Eligible for Either Reduced or Free Lunch: 374 (97.9%)
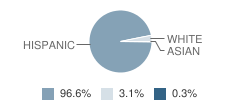
Student Enrollment Distribution by Race / Ethnicity
| Number | Percent | |
|---|---|---|
| American Indian | - | - |
| Black | - | - |
| Asian | 1 | 0.3% |
| Hispanic | 369 | 96.6% |
| White | 12 | 3.1% |
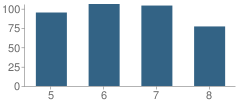
Number of Students Per Grade
| Number | Percent | |
|---|---|---|
| 5th Grade | 95 | 24.9% |
| 6th Grade | 106 | 27.7% |
| 7th Grade | 104 | 27.2% |
| 8th Grade | 77 | 20.2% |
Teacher Education Background (2009)
Percent With Master's Degree
School:
23.1%
District:
50.0%
Percent With Bachelor's Degree: 7.7%
Teacher Credentials & Experience (2009)
Percent of Teachers With Credentials: 95.5%
Number of Certificated Staff: 26.0
Average Number of Years of Teacher Experience: 10.0
Average Age
School:
37.2
District:
48.0
Source: CA Department of Education, Source: NCES 2009-2010
School Ratings and Reviews
Be The First To Review Sunset School!
School Map and Similar Schools Nearby
Click to Activate Map of Nearby School Campuses
Private
Public
This School
Similar Schools Nearby
| Vineland Elementary School KG-4 | 510 Students | 1.0 miles away | Not Yet Rated | |
| Lamont Elementary School KG-4 | 648 Students | 2.4 miles away | Not Yet Rated | |
| Myrtle Avenue Elementary School 4-6 | 426 Students | 2.5 miles away | Not Yet Rated | |
| Alicante Avenue Elementary School KG-6 | 1,112 Students | 2.6 miles away | Not Yet Rated | |
| Bear Mountain Elementary School KG-6 | 868 Students | 4.2 miles away | Not Yet Rated | |
| Sierra Vista Elementary School KG-6 | 895 Students | 5.0 miles away | Not Yet Rated | |
| El Camino Real Elementary School KG-6 | 877 Students | 5.1 miles away | Not Yet Rated | - |
| General Shafter Elementary School KG-8 | 185 Students | 6.4 miles away | Not Yet Rated | |
| Valle Verde Elementary School KG-5 | 703 Students | 7.0 miles away |  5 out of 5 | |
| Horizon Elementary School KG-5 | 709 Students | 7.1 miles away | Not Yet Rated | |
Compare This School To Nearby Schools ->
School Community Forum

Join a discussion about Sunset School and talk to others in the community including students, parents, teachers, and administrators.
Popular Discussion Topics
- Admissions and Registration Questions (e.g. Dress Code and Discipline Policy)
- School Calendar and Upcoming Events (e.g. Graduation)
- After School Programs, Extracurricular Activities, and Athletics (e.g. Football)
- News and Announcements (e.g. Yearbook and Class Supply List Details)
- Graduate and Alumni Events (e.g. Organizing Class Reunions)
Navigation
Can't Find What You Are Looking For?
Rankings
Nearby Cities
Sponsored Links
K-12 Articles

Transform Your Middle School Slacker into a Scholar
All children need motivation to learn. Have your child’s grades decreased since he started middle...
All children need motivation to learn. Have your child’s grades decreased since he started middle...

Teaching Kids to Deal with Peer Pressure
Parents usually become very concerned when they hear the term “peer pressure.” However, peer...
Parents usually become very concerned when they hear the term “peer pressure.” However, peer...

It's the Most Wonderful Time of the Year!
For most of the country, school is starting up this week or later this month-at the beginning of...
For most of the country, school is starting up this week or later this month-at the beginning of...