Golden West High School

4 out of 5 | 1 Review
Find Old Friends From Golden West High School
Use the form below to search for alumni from Golden West High School.
School Description
School Summary and Highlights
- Enrolls 1,821 high school students from grades 9-12
- Ranks 652nd out of 1,197 high schools in CA.
- 2010 Overall School AYP Met Status: No
Additional Contact Information
- Mailing Address: 1717 North Mcauliff Rd., Visalia, CA 93292
School District Details
- Visalia Unified School District
- Per-Pupil Spending: $8,127
- Graduation Rate: 72.5%
- Dropout Rate: 3.7%
- Students Per Teacher: 24.3
- Enrolled Students: 26,954
Faculty Details and Student Enrollment
Students and Faculty
- Total Students Enrolled: 1,821
- Total Full Time "Equivalent" Teachers: 79.1
- Average Student-To-Teacher Ratio: 23.0
Students Gender Breakdown
- Males: 900 (49.4%)
- Females: 921 (50.6%)
Free Lunch Student Eligibility Breakdown
- Eligible for Reduced Lunch: 136 (7.5%)
- Eligible for Free Lunch: 693 (38.1%)
- Eligible for Either Reduced or Free Lunch: 829 (45.5%)
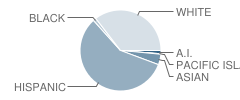
Student Enrollment Distribution by Race / Ethnicity

| Number | Percent | |
|---|---|---|
| American Indian | 25 | 1.4% |
| Black | 23 | 1.3% |
| Asian | 77 | 4.2% |
| Hispanic | 1,040 | 57.1% |
| White | 640 | 35.1% |
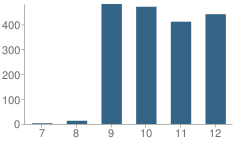
Number of Students Per Grade

| Number | Percent | |
|---|---|---|
| 7th Grade | 3 | 0.2% |
| 8th Grade | 13 | 0.7% |
| 9th Grade | 482 | 26.5% |
| 10th Grade | 471 | 25.9% |
| 11th Grade | 411 | 22.6% |
| 12th Grade | 441 | 24.2% |
Graduates Information (2010)
Graduation Rate
School:
89.5%
District:
79.5%
State:
78.6%
Teacher Education Background (2009)
Percent With Ph.D.
School:
1.1%
District:
1.6%
Percent With Master's Degree
School:
28.7%
District:
45.1%
Percent With Bachelor's Degree
School:
11.7%
District:
12.3%
Teacher Credentials & Experience (2009)
Percent of Teachers With Credentials: 96.5%
Number of Certificated Staff: 94.0
Average Number of Years of Teacher Experience: 19.3
Average Age
School:
45.0
District:
46.1
Source: CA Department of Education, Source: NCES 2009-2010
Sponsored Links
Test Scores and Performance Information
Overall School Rating
How is this determined?
The overall school rating shows that Golden West High School performed on average about the same as other schools across the state on CST state exams in the following subjects:
- CST Algebra I
- CST Algebra II
- CST Biology
- CST Chemistry
- CST Earth Science
- CST English-Language Arts
- CST General Mathematics
- CST Geometry
- CST Integrated Math 1
- CST Physics
- CST Science
- CST Summative High School Math
- CST U.S. History
- CST World History
AYP Results (2010)
Overall AYP Met: No
ELA AYP Met: No
Math AYP Met: No
ACT Exam Results (2009)
Percent of Students Taking ACT Exam: 23.2%
Average Combined Score: 19.9
Percent Scoring At or Above 21: 44.9%
SAT Exam Results (2009)
Percent of Students Taking SAT Exam: 23.4%
Average Combined Score: 1,449.7
Critical Reading Average: 484.0
Math Average: 488.9
Writing Average: 476.9
Percent Scoring At or Above 1500: 41.7%
CST - Test Proficiency by Grade and Subject
Grade 9 - % of students at or above proficiency
| School | District | State | |
|---|---|---|---|
| CST Algebra I Test | |||
| 2010 | 24.0% | 26.0% | 22.0% |
| 2009 | 13.0% | 22.0% | 21.0% |
| 2008 | 11.0% | 13.0% | 18.0% |
| CST Algebra II Test | |||
| 2010 | 64.0% | 78.0% | 69.0% |
| 2009 | 50.0% | 69.0% | 65.0% |
| 2008 | 38.0% | 63.0% | 66.0% |
| CST English-Language Arts Test | |||
| 2010 | 53.0% | 56.0% | 54.0% |
| 2009 | 41.0% | 47.0% | 50.0% |
| 2008 | 33.0% | 43.0% | 49.0% |
| CST General Mathematics Test | |||
| 2010 | 4.0% | 12.0% | 17.0% |
| CST Geometry Test | |||
| 2010 | 42.0% | 36.0% | 46.0% |
| 2009 | 45.0% | 50.0% | 47.0% |
| 2008 | 17.0% | 31.0% | 43.0% |
| CST Chemistry Test | |||
| 2008 | 54.0% | 58.0% | 44.0% |
Grade 10 - % of students at or above proficiency
| School | District | State | |
|---|---|---|---|
| CST Algebra I Test | |||
| 2010 | 15.0% | 16.0% | 12.0% |
| 2009 | 5.0% | 10.0% | 11.0% |
| 2008 | 3.0% | 4.0% | 9.0% |
| CST Algebra II Test | |||
| 2010 | 27.0% | 41.0% | 40.0% |
| 2009 | 8.0% | 19.0% | 37.0% |
| 2008 | 10.0% | 23.0% | 36.0% |
| CST Biology Test | |||
| 2010 | 55.0% | 52.0% | 38.0% |
| 2009 | 43.0% | 45.0% | 34.0% |
| 2008 | 45.0% | 43.0% | 35.0% |
| CST English-Language Arts Test | |||
| 2010 | 40.0% | 43.0% | 45.0% |
| 2009 | 32.0% | 39.0% | 44.0% |
| 2008 | 41.0% | 41.0% | 41.0% |
| CST Geometry Test | |||
| 2010 | 5.0% | 12.0% | 14.0% |
| 2009 | 8.0% | 13.0% | 14.0% |
| 2008 | 10.0% | 10.0% | 12.0% |
| CST Integrated Math 1 Test | |||
| 2010 | 3.0% | 3.0% | 11.0% |
| 2009 | 1.0% | 3.0% | 9.0% |
| CST Science Test | |||
| 2010 | 69.0% | 55.0% | 46.0% |
| 2009 | 53.0% | 50.0% | 44.0% |
| 2008 | 46.0% | 43.0% | 40.0% |
| CST Summative High School Math Test | |||
| 2010 | 40.0% | 60.0% | 75.0% |
| 2009 | 36.0% | 51.0% | 71.0% |
| 2008 | 39.0% | 53.0% | 68.0% |
| CST World History Test | |||
| 2010 | 37.0% | 43.0% | 42.0% |
| 2009 | 24.0% | 38.0% | 38.0% |
| 2008 | 24.0% | 32.0% | 33.0% |
Grade 11 - % of students at or above proficiency
| School | District | State | |
|---|---|---|---|
| CST Algebra I Test | |||
| 2010 | 16.0% | 13.0% | 8.0% |
| 2009 | 12.0% | 9.0% | 8.0% |
| 2008 | 2.0% | 5.0% | 5.0% |
| CST Algebra II Test | |||
| 2010 | 7.0% | 19.0% | 14.0% |
| 2009 | 7.0% | 13.0% | 12.0% |
| 2008 | 2.0% | 12.0% | 11.0% |
| CST Biology Test | |||
| 2010 | 64.0% | 39.0% | 46.0% |
| 2009 | 57.0% | 44.0% | 41.0% |
| 2008 | 40.0% | 38.0% | 39.0% |
| CST Chemistry Test | |||
| 2010 | 39.0% | 38.0% | 30.0% |
| 2009 | 29.0% | 31.0% | 27.0% |
| 2008 | 14.0% | 27.0% | 25.0% |
| CST English-Language Arts Test | |||
| 2010 | 36.0% | 38.0% | 42.0% |
| 2009 | 39.0% | 35.0% | 40.0% |
| 2008 | 29.0% | 33.0% | 37.0% |
| CST Geometry Test | |||
| 2010 | 3.0% | 8.0% | 6.0% |
| 2009 | 8.0% | 8.0% | 7.0% |
| 2008 | 2.0% | 8.0% | 6.0% |
| CST Integrated Math 1 Test | |||
| 2010 | 10.0% | 6.0% | 11.0% |
| 2009 | 7.0% | 4.0% | 9.0% |
| CST Summative High School Math Test | |||
| 2010 | 30.0% | 35.0% | 50.0% |
| 2009 | 29.0% | 34.0% | 47.0% |
| 2008 | 22.0% | 26.0% | 43.0% |
| CST U.S. History Test | |||
| 2010 | 38.0% | 41.0% | 45.0% |
| 2009 | 42.0% | 43.0% | 44.0% |
| 2008 | 32.0% | 36.0% | 38.0% |
| CST Physics Test | |||
| 2009 | 100.0% | 82.0% | 50.0% |
| 2008 | 91.0% | 86.0% | 47.0% |
| CST Earth Science Test | |||
| 2008 | 85.0% | 28.0% | 28.0% |
End of Course - % of students at or above proficiency
| School | District | State | |
|---|---|---|---|
| CST Algebra I Test | |||
| 2010 | 21.0% | 34.0% | 31.0% |
| 2009 | 11.0% | 30.0% | 28.0% |
| 2008 | 8.0% | 20.0% | 25.0% |
| CST Algebra II Test | |||
| 2010 | 21.0% | 34.0% | 31.0% |
| 2009 | 13.0% | 23.0% | 28.0% |
| 2008 | 10.0% | 24.0% | 27.0% |
| CST Biology Test | |||
| 2010 | 55.0% | 51.0% | 46.0% |
| 2009 | 44.0% | 45.0% | 42.0% |
| 2008 | 45.0% | 43.0% | 42.0% |
| CST Chemistry Test | |||
| 2010 | 41.0% | 42.0% | 38.0% |
| 2009 | 31.0% | 36.0% | 36.0% |
| 2008 | 17.0% | 32.0% | 32.0% |
| CST General Mathematics Test | |||
| 2010 | 4.0% | 12.0% | 27.0% |
| CST Geometry Test | |||
| 2010 | 15.0% | 24.0% | 27.0% |
| 2009 | 20.0% | 27.0% | 26.0% |
| 2008 | 9.0% | 21.0% | 24.0% |
| CST Integrated Math 1 Test | |||
| 2010 | 6.0% | 5.0% | 13.0% |
| 2009 | 4.0% | 4.0% | 11.0% |
| CST Summative High School Math Test | |||
| 2010 | 33.0% | 41.0% | 54.0% |
| 2009 | 31.0% | 38.0% | 50.0% |
| 2008 | 30.0% | 33.0% | 47.0% |
| CST World History Test | |||
| 2010 | 37.0% | 41.0% | 41.0% |
| 2009 | 24.0% | 37.0% | 38.0% |
| 2008 | 24.0% | 31.0% | 33.0% |
| CST Physics Test | |||
| 2009 | 100.0% | 82.0% | 46.0% |
| 2008 | 91.0% | 86.0% | 43.0% |
| CST Earth Science Test | |||
| 2008 | 85.0% | 28.0% | 28.0% |
Source: CA Department of Education 2009-2010
School Map and Similar Schools Nearby
Click to Activate Map of Nearby School Campuses
Private
Public
This School
Similar Schools Nearby
| Farmersville Junior High School 6-8 | 582 Students | 2.2 miles away | Not Yet Rated | |
| Farmersville High School 9-12 | 678 Students | 2.2 miles away | Not Yet Rated | |
| Mt. Whitney High School 9-12 | 1,692 Students | 2.7 miles away | Not Yet Rated | |
| Redwood High School 9-12 | 1,958 Students | 3.1 miles away | Not Yet Rated | |
| El Diamante High School 9-12 | 1,977 Students | 5.3 miles away | ![]() 4 out of 5 | |
| Exeter High School 9-12 | 1,032 Students | 6.5 miles away | ![]() 3.5 out of 5 | |
| Tulare High School 9-12 | 1,880 Students | 8.7 miles away | Not Yet Rated | |
| Tulare Western High School 9-12 | 1,919 Students | 9.0 miles away | ![]() 5 out of 5 | |
| Woodlake High School 9-12 | 781 Students | 11.1 miles away | Not Yet Rated | |
| Steve Garvey Junior High School 7-8 | 606 Students | 12.0 miles away | Not Yet Rated | |
Compare This School To Nearby Schools ->
School Community Forum

Join a discussion about Golden West High School and talk to others in the community including students, parents, teachers, and administrators.
Popular Discussion Topics
- Admissions and Registration Questions (e.g. Dress Code and Discipline Policy)
- School Calendar and Upcoming Events (e.g. Graduation)
- After School Programs, Extracurricular Activities, and Athletics (e.g. Football)
- News and Announcements (e.g. Yearbook and Class Supply List Details)
- Graduate and Alumni Events (e.g. Organizing Class Reunions)
Navigation
Can't Find What You Are Looking For?
Rankings
Nearby Cities
Sponsored Links
K-12 Articles
How to Get the Best Supplies for Your Money
School supply lists can seem unending, and the price can add up very quickly. But do we really...
Helping Young Children with Printing and Cursive Writing
Is your child experiencing difficulty printing or writing? Is he unable to print or write legibly,...
Educators and Childhood Obesity
Obesity in childhood is rising to epidemic proportions in America and educators should be...


(4 / 5) 

