West Park Charter Academy

No Reviews Yet
Find Old Friends From West Park Charter Academy
Use the form below to search for alumni from West Park Charter Academy.
School Description
School Summary and Highlights
- Enrolls 634 elementary, middle, and high school students from grades KG-12
- Ranks 1120th out of 1,197 high schools in CA.
- 2010 Overall School AYP Met Status: No
Additional Contact Information
- Mailing Address: 2695 South Valentine Ave., Fresno, CA 93706
School Operational Details
- Charter School
School District Details
- West Park Elementary School District
- Per-Pupil Spending: $11,115
- Graduation Rate: 100.0%
- Dropout Rate: 26.6%
- Students Per Teacher: 18.4
- Enrolled Students: 966
Faculty Details and Student Enrollment
Students and Faculty
- Total Students Enrolled: 634
- Total Full Time "Equivalent" Teachers: 32.5
- Average Student-To-Teacher Ratio: 19.5
Students Gender Breakdown
- Males: 288 (45.4%)
- Females: 346 (54.6%)
Free Lunch Student Eligibility Breakdown
- Eligible for Reduced Lunch: 160 (25.2%)
- Eligible for Free Lunch: 271 (42.7%)
- Eligible for Either Reduced or Free Lunch: 431 (68.0%)
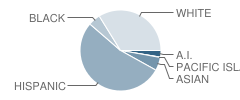
Student Enrollment Distribution by Race / Ethnicity

| Number | Percent | |
|---|---|---|
| American Indian | 17 | 2.7% |
| Black | 31 | 4.9% |
| Asian | 34 | 5.4% |
| Hispanic | 337 | 53.2% |
| White | 214 | 33.8% |
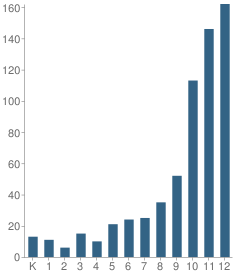
Number of Students Per Grade

| Number | Percent | |
|---|---|---|
| Kindergarten | 13 | 2.1% |
| 1st Grade | 11 | 1.7% |
| 2nd Grade | 6 | 0.9% |
| 3rd Grade | 15 | 2.4% |
| 4th Grade | 10 | 1.6% |
| 5th Grade | 21 | 3.3% |
| 6th Grade | 24 | 3.8% |
| 7th Grade | 25 | 3.9% |
| 8th Grade | 35 | 5.5% |
| 9th Grade | 52 | 8.2% |
| 10th Grade | 113 | 17.8% |
| 11th Grade | 146 | 23.0% |
| 12th Grade | 162 | 25.6% |
| Ungraded | 1 | 0.2% |
Graduates Information (2010)
Graduation Rate
School:
44.5%
State:
78.6%
Teacher Education Background (2009)
Percent With Master's Degree
School:
11.1%
District:
33.3%
Percent With Bachelor's Degree: 25.0%
Teacher Credentials & Experience (2009)
Percent of Teachers With Emergency Credentials: 3.0%
Percent of Teachers With Credentials: 97.0%
Number of Certificated Staff: 36.0
Average Number of Years of Teacher Experience: 4.3
Average Age
School:
39.6
District:
55.3
Source: CA Department of Education, Source: NCES 2009-2010
School Ratings and Reviews
Be The First To Review West Park Charter Academy!
Sponsored Links
Test Scores and Performance Information
Overall School Rating
How is this determined?
The overall school rating shows that West Park Charter Academy performed on average much worse than most other schools across the state on CST state exams in the following subjects:
- CST Algebra I
- CST Biology
- CST Earth Science
- CST English-Language Arts
- CST General Mathematics
- CST Geometry
- CST History - Social Science
- CST Mathematics
- CST Science
- CST U.S. History
- CST World History
AYP Results (2010)
Overall AYP Met: No
ELA AYP Met: No
Math AYP Met: No
ACT Exam Results (2009)
Percent of Students Taking ACT Exam: 0.8%
SAT Exam Results (2009)
Percent of Students Taking SAT Exam: 3.7%
CST - Test Proficiency by Grade and Subject
Grade 3 - % of students at or above proficiency
| School | District | State | |
|---|---|---|---|
| CST English-Language Arts Test | |||
| 2010 | 8.0% | 10.0% | 43.0% |
| 2009 | 18.0% | 31.0% | 44.0% |
| CST Mathematics Test | |||
| 2010 | 8.0% | 27.0% | 65.0% |
| 2009 | 45.0% | 54.0% | 64.0% |
Grade 5 - % of students at or above proficiency
| School | District | State | |
|---|---|---|---|
| CST English-Language Arts Test | |||
| 2010 | 29.0% | 25.0% | 58.0% |
| 2009 | 27.0% | 33.0% | 54.0% |
| 2008 | 50.0% | 29.0% | 48.0% |
| CST Mathematics Test | |||
| 2010 | 35.0% | 45.0% | 61.0% |
| 2009 | 47.0% | 57.0% | 57.0% |
| 2008 | 14.0% | 14.0% | 51.0% |
| CST Science Test | |||
| 2010 | 41.0% | 30.0% | 56.0% |
| 2009 | 7.0% | 12.0% | 49.0% |
| 2008 | 28.0% | 21.0% | 46.0% |
Grade 6 - % of students at or above proficiency
| School | District | State | |
|---|---|---|---|
| CST English-Language Arts Test | |||
| 2010 | 19.0% | 30.0% | 55.0% |
| 2009 | 24.0% | 19.0% | 52.0% |
| 2008 | 22.0% | 22.0% | 47.0% |
| CST Mathematics Test | |||
| 2010 | 16.0% | 27.0% | 52.0% |
| 2009 | 24.0% | 18.0% | 49.0% |
| 2008 | 23.0% | 14.0% | 44.0% |
Grade 7 - % of students at or above proficiency
| School | District | State | |
|---|---|---|---|
| CST English-Language Arts Test | |||
| 2010 | 31.0% | 28.0% | 55.0% |
| 2009 | 21.0% | 24.0% | 54.0% |
| 2008 | 14.0% | 23.0% | 49.0% |
| CST Mathematics Test | |||
| 2010 | 14.0% | 18.0% | 48.0% |
| 2009 | 12.0% | 11.0% | 43.0% |
| 2008 | 9.0% | 13.0% | 41.0% |
Grade 8 - % of students at or above proficiency
| School | District | State | |
|---|---|---|---|
| CST Algebra I Test | |||
| 2010 | 45.0% | 53.0% | 46.0% |
| CST English-Language Arts Test | |||
| 2010 | 28.0% | 27.0% | 54.0% |
| 2009 | 4.0% | 15.0% | 48.0% |
| 2008 | 24.0% | 21.0% | 45.0% |
| CST General Mathematics Test | |||
| 2010 | 12.0% | 13.0% | 30.0% |
| 2009 | 13.0% | 21.0% | 30.0% |
| 2008 | 12.0% | 14.0% | 31.0% |
| CST History - Social Science Test | |||
| 2010 | 20.0% | 16.0% | 47.0% |
| 2009 | 2.0% | 8.0% | 42.0% |
| 2008 | 15.0% | 13.0% | 36.0% |
| CST Science Test | |||
| 2010 | 22.0% | 26.0% | 59.0% |
| 2009 | 9.0% | 24.0% | 56.0% |
| 2008 | 15.0% | 18.0% | 52.0% |
Grade 9 - % of students at or above proficiency
| School | District | State | |
|---|---|---|---|
| CST Algebra I Test | |||
| 2010 | 10.0% | 10.0% | 22.0% |
| 2009 | 1.0% | 1.0% | 21.0% |
| 2008 | 5.0% | 5.0% | 18.0% |
| CST Earth Science Test | |||
| 2010 | 15.0% | 15.0% | 35.0% |
| 2009 | 7.0% | 7.0% | 29.0% |
| 2008 | 8.0% | 8.0% | 31.0% |
| CST English-Language Arts Test | |||
| 2010 | 17.0% | 17.0% | 54.0% |
| 2009 | 15.0% | 15.0% | 50.0% |
| 2008 | 19.0% | 19.0% | 49.0% |
| CST General Mathematics Test | |||
| 2010 | 16.0% | 16.0% | 17.0% |
| 2009 | 4.0% | 4.0% | 17.0% |
| 2008 | 15.0% | 15.0% | 18.0% |
Grade 10 - % of students at or above proficiency
| School | District | State | |
|---|---|---|---|
| CST Algebra I Test | |||
| 2010 | 7.0% | 7.0% | 12.0% |
| 2009 | 1.0% | 1.0% | 11.0% |
| 2008 | 4.0% | 4.0% | 9.0% |
| CST Biology Test | |||
| 2010 | 9.0% | 9.0% | 38.0% |
| 2009 | 6.0% | 6.0% | 34.0% |
| 2008 | 10.0% | 10.0% | 35.0% |
| CST English-Language Arts Test | |||
| 2010 | 14.0% | 14.0% | 45.0% |
| 2009 | 11.0% | 11.0% | 44.0% |
| 2008 | 15.0% | 15.0% | 41.0% |
| CST Geometry Test | |||
| 2010 | 8.0% | 8.0% | 14.0% |
| CST Science Test | |||
| 2010 | 8.0% | 8.0% | 46.0% |
| 2009 | 10.0% | 10.0% | 44.0% |
| 2008 | 8.0% | 8.0% | 40.0% |
| CST World History Test | |||
| 2010 | 11.0% | 11.0% | 42.0% |
| 2009 | 4.0% | 4.0% | 38.0% |
| 2008 | 3.0% | 3.0% | 33.0% |
Grade 11 - % of students at or above proficiency
| School | District | State | |
|---|---|---|---|
| CST Biology Test | |||
| 2010 | 7.0% | 7.0% | 46.0% |
| CST Earth Science Test | |||
| 2010 | 13.0% | 13.0% | 32.0% |
| 2009 | 6.0% | 6.0% | 26.0% |
| CST English-Language Arts Test | |||
| 2010 | 13.0% | 13.0% | 42.0% |
| 2009 | 12.0% | 12.0% | 40.0% |
| 2008 | 17.0% | 17.0% | 37.0% |
| CST U.S. History Test | |||
| 2010 | 10.0% | 10.0% | 45.0% |
| 2009 | 9.0% | 9.0% | 44.0% |
| 2008 | 6.0% | 6.0% | 38.0% |
End of Course - % of students at or above proficiency
| School | District | State | |
|---|---|---|---|
| CST Algebra I Test | |||
| 2010 | 13.0% | 17.0% | 31.0% |
| 2009 | 1.0% | 3.0% | 28.0% |
| 2008 | 4.0% | 6.0% | 25.0% |
| CST Biology Test | |||
| 2010 | 8.0% | 8.0% | 46.0% |
| 2009 | 5.0% | 5.0% | 42.0% |
| 2008 | 10.0% | 10.0% | 42.0% |
| CST Earth Science Test | |||
| 2010 | 15.0% | 15.0% | 33.0% |
| 2009 | 7.0% | 7.0% | 28.0% |
| 2008 | 8.0% | 8.0% | 28.0% |
| CST General Mathematics Test | |||
| 2010 | 14.0% | 14.0% | 27.0% |
| 2009 | 10.0% | 17.0% | 26.0% |
| 2008 | 13.0% | 15.0% | 27.0% |
| CST Geometry Test | |||
| 2010 | 8.0% | 8.0% | 27.0% |
| CST World History Test | |||
| 2010 | 9.0% | 9.0% | 41.0% |
| 2009 | 4.0% | 4.0% | 38.0% |
| 2008 | 3.0% | 3.0% | 33.0% |
Grade 2 - % of students at or above proficiency
| School | District | State | |
|---|---|---|---|
| CST English-Language Arts Test | |||
| 2008 | 18.0% | 33.0% | 48.0% |
| CST Mathematics Test | |||
| 2008 | 6.0% | 36.0% | 59.0% |
Grade 4 - % of students at or above proficiency
| School | District | State | |
|---|---|---|---|
| CST English-Language Arts Test | |||
| 2008 | 13.0% | 34.0% | 55.0% |
| CST Mathematics Test | |||
| 2008 | 20.0% | 34.0% | 61.0% |
Source: CA Department of Education 2009-2010
School Map and Similar Schools Nearby
Click to Activate Map of Nearby School Campuses
Private
Public
This School
Similar Schools Nearby
| W.e.b. Dubois Public Charter School KG-12 | 406 Students | 3.0 miles away | Not Yet Rated | |
| Big Picture High School - Fresno 7-12 | 87 Students | 3.7 miles away | Not Yet Rated | - |
| New Millenium Charter School 7-12 | 264 Students | 3.7 miles away | Not Yet Rated | |
| School of Unlimited Learning 9-12 | 255 Students | 4.9 miles away | ![]() 5 out of 5 | |
| Fresno Academy for Civic and Entrepreneurial Leadership 9-12 | 50 Students | 5.9 miles away | Not Yet Rated | - |
| Valley Preparatory Academy KG-12 | 241 Students | 7.2 miles away | Not Yet Rated | |
| Crescent View South Charter School KG-12 | 490 Students | 7.2 miles away | Not Yet Rated | - |
| Carter G. Woodson Public Charter School 7-12 | 427 Students | 7.8 miles away | Not Yet Rated | |
| Sierra Charter School KG-12 | 729 Students | 8.7 miles away | Not Yet Rated | - |
| Clovis Online Charter School 7-12 | 63 Students | 13.6 miles away | Not Yet Rated | - |
Compare This School To Nearby Schools ->
School Community Forum

Join a discussion about West Park Charter Academy and talk to others in the community including students, parents, teachers, and administrators.
Popular Discussion Topics
- Admissions and Registration Questions (e.g. Dress Code and Discipline Policy)
- School Calendar and Upcoming Events (e.g. Graduation)
- After School Programs, Extracurricular Activities, and Athletics (e.g. Football)
- News and Announcements (e.g. Yearbook and Class Supply List Details)
- Graduate and Alumni Events (e.g. Organizing Class Reunions)
Navigation
Can't Find What You Are Looking For?
Rankings
Nearby Cities
Sponsored Links
K-12 Articles
Public or Private?
Daniel attended private school until sixth grade, when he was diagnosed with Asperger's Syndrome, a...
Choosing a Summer Camp for Your Child
Are you planning to send your child to summer camp this year? If so, have you taken his needs into...
Teach Your Child to Write Well
When American children head off to junior kindergarten, they must be ready to learn. It is your...

