Valencia High School

No Reviews Yet
Find Old Friends From Valencia High School
Use the form below to search for alumni from Valencia High School.
School Description
School Summary and Highlights
- Enrolls 3,025 high school students from grades 9-12
- Ranks 95th out of 1,197 high schools in CA.
- 2010 Overall School AYP Met Status: No
Additional Contact Information
- Mailing Address: 27801 North Dickason Dr., Valencia, CA 91355
School District Details
- William S. Hart Union High School District
- Per-Pupil Spending: $8,003
- Graduation Rate: 97.3%
- Dropout Rate: 2.6%
- Students Per Teacher: 27.5
- Enrolled Students: 26,183
Faculty Details and Student Enrollment
Students and Faculty
- Total Students Enrolled: 3,025
- Total Full Time "Equivalent" Teachers: 105.0
- Average Student-To-Teacher Ratio: 28.8
Students Gender Breakdown
- Males: 1,543 (51.0%)
- Females: 1,482 (49.0%)
Free Lunch Student Eligibility Breakdown
- Eligible for Reduced Lunch: 44 (1.5%)
- Eligible for Free Lunch: 123 (4.1%)
- Eligible for Either Reduced or Free Lunch: 167 (5.5%)
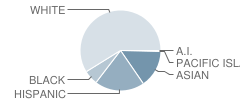
Student Enrollment Distribution by Race / Ethnicity

| Number | Percent | |
|---|---|---|
| American Indian | 9 | 0.3% |
| Black | 176 | 5.8% |
| Asian | 454 | 15.0% |
| Hispanic | 603 | 19.9% |
| White | 1,771 | 58.5% |
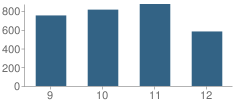
Number of Students Per Grade

| Number | Percent | |
|---|---|---|
| 9th Grade | 753 | 24.9% |
| 10th Grade | 815 | 26.9% |
| 11th Grade | 875 | 28.9% |
| 12th Grade | 582 | 19.2% |
Graduates Information (2010)
Graduation Rate
School:
97.3%
District:
95.4%
State:
78.6%
Teacher Education Background (2009)
Percent With Ph.D.: 3.1%
Percent With Master's Degree
School:
37.5%
District:
36.7%
Percent With Bachelor's Degree
School:
9.4%
District:
1.7%
Teacher Credentials & Experience (2009)
Percent of Teachers With Emergency Credentials: 4.3%
Percent of Teachers With Credentials: 93.0%
Number of Certificated Staff: 128.0
Average Number of Years of Teacher Experience: 14.0
Average Age
School:
42.6
District:
45.3
Source: CA Department of Education, Source: NCES 2009-2010
School Ratings and Reviews
Be The First To Review Valencia High School!
Sponsored Links
Test Scores and Performance Information
Overall School Rating
How is this determined?
The overall school rating shows that Valencia High School performed on average much better than most other schools across the state on CST state exams in the following subjects:
- CST Algebra I
- CST Algebra II
- CST Biology
- CST Chemistry
- CST Earth Science
- CST English-Language Arts
- CST General Mathematics
- CST Geometry
- CST Physics
- CST Science
- CST Summative High School Math
- CST U.S. History
- CST World History
AYP Results (2010)
Overall AYP Met: No
ELA AYP Met: Yes
Math AYP Met: No
ACT Exam Results (2009)
Percent of Students Taking ACT Exam: 27.6%
Average Combined Score: 24.8
Percent Scoring At or Above 21: 82.1%
SAT Exam Results (2009)
Percent of Students Taking SAT Exam: 54.2%
Average Combined Score: 1,635.3
Critical Reading Average: 532.9
Math Average: 566.7
Writing Average: 535.7
Percent Scoring At or Above 1500: 70.4%
CST - Test Proficiency by Grade and Subject
Grade 9 - % of students at or above proficiency
| School | District | State | |
|---|---|---|---|
| CST Algebra I Test | |||
| 2010 | 62.0% | 43.0% | 22.0% |
| 2009 | 49.0% | 41.0% | 21.0% |
| 2008 | 42.0% | 43.0% | 18.0% |
| CST Algebra II Test | |||
| 2010 | 96.0% | 89.0% | 69.0% |
| 2009 | 91.0% | 86.0% | 65.0% |
| 2008 | 94.0% | 85.0% | 66.0% |
| CST Biology Test | |||
| 2010 | 78.0% | 64.0% | 55.0% |
| 2009 | 77.0% | 61.0% | 51.0% |
| 2008 | 65.0% | 59.0% | 52.0% |
| CST Earth Science Test | |||
| 2010 | 37.0% | 47.0% | 35.0% |
| 2009 | 30.0% | 37.0% | 29.0% |
| 2008 | 41.0% | 45.0% | 31.0% |
| CST English-Language Arts Test | |||
| 2010 | 81.0% | 72.0% | 54.0% |
| 2009 | 73.0% | 68.0% | 50.0% |
| 2008 | 69.0% | 65.0% | 49.0% |
| CST General Mathematics Test | |||
| 2010 | 37.0% | 31.0% | 17.0% |
| 2009 | 32.0% | 31.0% | 17.0% |
| 2008 | 34.0% | 34.0% | 18.0% |
| CST Geometry Test | |||
| 2010 | 80.0% | 74.0% | 46.0% |
| 2009 | 92.0% | 82.0% | 47.0% |
| 2008 | 61.0% | 66.0% | 43.0% |
Grade 10 - % of students at or above proficiency
| School | District | State | |
|---|---|---|---|
| CST Algebra I Test | |||
| 2010 | 19.0% | 21.0% | 12.0% |
| 2009 | 20.0% | 23.0% | 11.0% |
| 2008 | 23.0% | 22.0% | 9.0% |
| CST Algebra II Test | |||
| 2010 | 77.0% | 57.0% | 40.0% |
| 2009 | 58.0% | 48.0% | 37.0% |
| 2008 | 56.0% | 57.0% | 36.0% |
| CST Biology Test | |||
| 2010 | 33.0% | 47.0% | 38.0% |
| 2009 | 28.0% | 43.0% | 34.0% |
| 2008 | 45.0% | 41.0% | 35.0% |
| CST Chemistry Test | |||
| 2010 | 69.0% | 62.0% | 47.0% |
| 2009 | 72.0% | 61.0% | 44.0% |
| 2008 | 55.0% | 49.0% | 41.0% |
| CST Earth Science Test | |||
| 2010 | 50.0% | 48.0% | 29.0% |
| 2009 | 26.0% | 41.0% | 23.0% |
| 2008 | 47.0% | 48.0% | 23.0% |
| CST English-Language Arts Test | |||
| 2010 | 66.0% | 62.0% | 45.0% |
| 2009 | 67.0% | 59.0% | 44.0% |
| 2008 | 65.0% | 57.0% | 41.0% |
| CST Geometry Test | |||
| 2010 | 28.0% | 28.0% | 14.0% |
| 2009 | 39.0% | 45.0% | 14.0% |
| 2008 | 19.0% | 38.0% | 12.0% |
| CST Science Test | |||
| 2010 | 68.0% | 65.0% | 46.0% |
| 2009 | 64.0% | 62.0% | 44.0% |
| 2008 | 66.0% | 54.0% | 40.0% |
| CST Summative High School Math Test | |||
| 2010 | 93.0% | 89.0% | 75.0% |
| 2009 | 92.0% | 88.0% | 71.0% |
| 2008 | 98.0% | 91.0% | 68.0% |
| CST World History Test | |||
| 2010 | 61.0% | 54.0% | 42.0% |
| 2009 | 54.0% | 52.0% | 38.0% |
| 2008 | 51.0% | 45.0% | 33.0% |
Grade 11 - % of students at or above proficiency
| School | District | State | |
|---|---|---|---|
| CST Algebra I Test | |||
| 2010 | 11.0% | 12.0% | 8.0% |
| 2009 | 9.0% | 15.0% | 8.0% |
| 2008 | 10.0% | 13.0% | 5.0% |
| CST Algebra II Test | |||
| 2010 | 29.0% | 22.0% | 14.0% |
| 2009 | 18.0% | 23.0% | 12.0% |
| 2008 | 23.0% | 27.0% | 11.0% |
| CST Biology Test | |||
| 2010 | 71.0% | 69.0% | 46.0% |
| 2009 | 81.0% | 67.0% | 41.0% |
| 2008 | 77.0% | 61.0% | 39.0% |
| CST Chemistry Test | |||
| 2010 | 40.0% | 39.0% | 30.0% |
| 2009 | 27.0% | 29.0% | 27.0% |
| 2008 | 28.0% | 34.0% | 25.0% |
| CST Earth Science Test | |||
| 2010 | 60.0% | 51.0% | 32.0% |
| 2009 | 45.0% | 42.0% | 26.0% |
| 2008 | 51.0% | 50.0% | 28.0% |
| CST English-Language Arts Test | |||
| 2010 | 64.0% | 57.0% | 42.0% |
| 2009 | 64.0% | 55.0% | 40.0% |
| 2008 | 69.0% | 56.0% | 37.0% |
| CST Geometry Test | |||
| 2010 | 14.0% | 21.0% | 6.0% |
| 2009 | 10.0% | 22.0% | 7.0% |
| 2008 | 5.0% | 23.0% | 6.0% |
| CST Physics Test | |||
| 2010 | 77.0% | 78.0% | 53.0% |
| 2009 | 65.0% | 71.0% | 50.0% |
| 2008 | 89.0% | 75.0% | 47.0% |
| CST Summative High School Math Test | |||
| 2010 | 73.0% | 68.0% | 50.0% |
| 2009 | 78.0% | 68.0% | 47.0% |
| 2008 | 87.0% | 71.0% | 43.0% |
| CST U.S. History Test | |||
| 2010 | 66.0% | 57.0% | 45.0% |
| 2009 | 68.0% | 58.0% | 44.0% |
| 2008 | 63.0% | 53.0% | 38.0% |
End of Course - % of students at or above proficiency
| School | District | State | |
|---|---|---|---|
| CST Algebra I Test | |||
| 2010 | 35.0% | 51.0% | 31.0% |
| 2009 | 31.0% | 47.0% | 28.0% |
| 2008 | 34.0% | 44.0% | 25.0% |
| CST Algebra II Test | |||
| 2010 | 55.0% | 48.0% | 31.0% |
| 2009 | 46.0% | 45.0% | 28.0% |
| 2008 | 47.0% | 48.0% | 27.0% |
| CST Biology Test | |||
| 2010 | 64.0% | 61.0% | 46.0% |
| 2009 | 63.0% | 58.0% | 42.0% |
| 2008 | 63.0% | 55.0% | 42.0% |
| CST Chemistry Test | |||
| 2010 | 62.0% | 56.0% | 38.0% |
| 2009 | 66.0% | 53.0% | 36.0% |
| 2008 | 50.0% | 44.0% | 32.0% |
| CST Earth Science Test | |||
| 2010 | 45.0% | 48.0% | 33.0% |
| 2009 | 31.0% | 40.0% | 28.0% |
| 2008 | 43.0% | 46.0% | 28.0% |
| CST General Mathematics Test | |||
| 2010 | 37.0% | 49.0% | 27.0% |
| 2009 | 32.0% | 50.0% | 26.0% |
| 2008 | 34.0% | 48.0% | 27.0% |
| CST Geometry Test | |||
| 2010 | 47.0% | 51.0% | 27.0% |
| 2009 | 58.0% | 58.0% | 26.0% |
| 2008 | 37.0% | 49.0% | 24.0% |
| CST Physics Test | |||
| 2010 | 77.0% | 77.0% | 49.0% |
| 2009 | 65.0% | 67.0% | 46.0% |
| 2008 | 90.0% | 72.0% | 43.0% |
| CST Summative High School Math Test | |||
| 2010 | 76.0% | 72.0% | 54.0% |
| 2009 | 81.0% | 73.0% | 50.0% |
| 2008 | 90.0% | 75.0% | 47.0% |
| CST World History Test | |||
| 2010 | 60.0% | 53.0% | 41.0% |
| 2009 | 54.0% | 51.0% | 38.0% |
| 2008 | 50.0% | 44.0% | 33.0% |
Source: CA Department of Education 2009-2010
School Map and Similar Schools Nearby
Click to Activate Map of Nearby School Campuses
Private
Public
This School
Similar Schools Nearby
| Rio Norte Junior High School 7-8 | 1,373 Students | 1.3 miles away | Not Yet Rated | |
| Arroyo Seco Junior High School 7-8 | 1,180 Students | 1.5 miles away | Not Yet Rated | |
| Academy of the Canyons 9-12 | 375 Students | 2.4 miles away | ![]() 5 out of 5 | |
| Saugus High School 9-12 | 2,483 Students | 2.5 miles away | ![]() 5 out of 5 | |
| West Ranch High School 9-12 | 2,738 Students | 3.3 miles away | Not Yet Rated | |
| Rancho Pico Junior High School 7-8 | 1,033 Students | 3.3 miles away | Not Yet Rated | |
| Placerita Junior High School 7-8 | 941 Students | 3.9 miles away | Not Yet Rated | |
| William S. Hart High School 9-12 | 2,190 Students | 4.2 miles away | Not Yet Rated | |
| Golden Valley High School 9-12 | 2,181 Students | 5.0 miles away | Not Yet Rated | |
| La Mesa Junior High School 7-8 | 1,267 Students | 5.1 miles away | ![]() 5 out of 5 | |
Compare This School To Nearby Schools ->
School Community Forum

Join a discussion about Valencia High School and talk to others in the community including students, parents, teachers, and administrators.
Popular Discussion Topics
- Admissions and Registration Questions (e.g. Dress Code and Discipline Policy)
- School Calendar and Upcoming Events (e.g. Graduation)
- After School Programs, Extracurricular Activities, and Athletics (e.g. Football)
- News and Announcements (e.g. Yearbook and Class Supply List Details)
- Graduate and Alumni Events (e.g. Organizing Class Reunions)
Navigation
Can't Find What You Are Looking For?
Rankings
Nearby Cities
Sponsored Links
K-12 Articles
Homework Helps
School has started throughout the country and is well into the first month-some schools are...
Cutting Class
Depression is a very real problem for today's youth. When your spirit doesn't feel good, a lot of...
The Impact on Adopted Children at School
Children who are adopted can be affected both academically and socially at school. Many times...

