Tierra Buena Elementary School
Rating
Not Available
Not Available

5 out of 5 | 1 Review
Find Old Friends From Tierra Buena Elementary School
Use the form below to search for alumni from Tierra Buena Elementary School.
School Description
School Summary and Highlights
- Enrolls 743 elementary school students from grades KG-8
- Ranks 554th out of 2,050 middle schools in CA.
- 2010 Overall School AYP Met Status: No
Additional Contact Information
- Mailing Address: 1794 Villa Ave., Yuba City, CA 95993
School Operational Details
- Title I Eligible
School District Details
- Yuba City Unified School District
- Per-Pupil Spending: $8,275
- Graduation Rate: 82.7%
- Dropout Rate: 3.8%
- Students Per Teacher: 22.1
- Enrolled Students: 13,268
Faculty Details and Student Enrollment
Students and Faculty
- Total Students Enrolled: 743
- Total Full Time "Equivalent" Teachers: 32.5
- Average Student-To-Teacher Ratio: 22.9
Students Gender Breakdown
- Males: 365 (49.1%)
- Females: 378 (50.9%)
Free Lunch Student Eligibility Breakdown
- Eligible for Reduced Lunch: 65 (8.7%)
- Eligible for Free Lunch: 272 (36.6%)
- Eligible for Either Reduced or Free Lunch: 337 (45.4%)
Student Enrollment Distribution by Race / Ethnicity
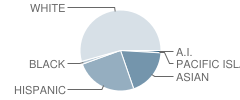
| Number | Percent | |
|---|---|---|
| American Indian | 6 | 0.8% |
| Black | 8 | 1.1% |
| Asian | 128 | 17.2% |
| Hispanic | 169 | 22.7% |
| White | 370 | 49.8% |
Number of Students Per Grade
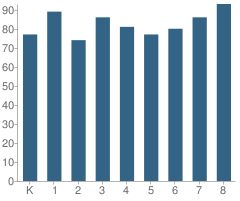
| Number | Percent | |
|---|---|---|
| Kindergarten | 77 | 10.4% |
| 1st Grade | 89 | 12.0% |
| 2nd Grade | 74 | 10.0% |
| 3rd Grade | 86 | 11.6% |
| 4th Grade | 81 | 10.9% |
| 5th Grade | 77 | 10.4% |
| 6th Grade | 80 | 10.8% |
| 7th Grade | 86 | 11.6% |
| 8th Grade | 93 | 12.5% |
Teacher Education Background (2009)
Percent With Master's Degree
School:
14.3%
District:
40.9%
Percent With Bachelor's Degree: 9.5%
Teacher Credentials & Experience (2009)
Percent of Teachers With Credentials: 100.0%
Number of Certificated Staff: 42.0
Average Number of Years of Teacher Experience: 17.5
Average Age
School:
48.1
District:
43.9
Source: CA Department of Education, Source: NCES 2009-2010
School Ratings and Reviews
Overall Rating: 5

5 out of 5 | 1 Review
The Overall Rating is the school's average rating from parents, students, school faculty and staff. The highest rating is five apples and the lowest is one apple.
Share Your Review About This School
1 review for Tierra Buena Elementary School
- Reviewed by Parent/Guardian on August 11, 2010
- Rating:
 (5 / 5) Flag as inappropriate
 - im a parent and my vhild got in trouble for spreading a rumor and the vice principal blamed it all on my child and i was pist i think she needs some time off till she gets rid of her anger issues
School Map and Similar Schools Nearby
Click to Activate Map of Nearby School Campuses
Private
Public
This School
Similar Schools Nearby
| Butte Vista Elementary School KG-8 | 946 Students | 0.8 miles away |  5 out of 5 | |
| April Lane Elementary School KG-5 | 492 Students | 1.9 miles away | Not Yet Rated | |
| King Avenue Elementary School KG-5 | 419 Students | 2.2 miles away | Not Yet Rated | |
| Franklin Elementary School KG-8 | 467 Students | 2.2 miles away | 5 out of 5 | |
| West Walton Elementary School KG-8 | 1,348 Students | 2.3 miles away | Not Yet Rated | |
| Nuestro Elementary School KG-8 | 118 Students | 2.5 miles away | Not Yet Rated | |
| Bridge Street Elementary School KG-5 | 449 Students | 2.9 miles away | Not Yet Rated | |
| Lincoln Elementary School KG-5 | 649 Students | 3.0 miles away | 5 out of 5 | |
| Park Avenue Elementary School KG-5 | 580 Students | 3.1 miles away | Not Yet Rated | |
| Lincrest Elementary School KG-5 | 735 Students | 3.6 miles away | Not Yet Rated | |
Compare This School To Nearby Schools ->
School Community Forum

Join a discussion about Tierra Buena Elementary School and talk to others in the community including students, parents, teachers, and administrators.
Popular Discussion Topics
- Admissions and Registration Questions (e.g. Dress Code and Discipline Policy)
- School Calendar and Upcoming Events (e.g. Graduation)
- After School Programs, Extracurricular Activities, and Athletics (e.g. Football)
- News and Announcements (e.g. Yearbook and Class Supply List Details)
- Graduate and Alumni Events (e.g. Organizing Class Reunions)
Navigation
Can't Find What You Are Looking For?
Rankings
Nearby Cities
Sponsored Links
K-12 Articles

The Very Best Things in the World
A recent poll in the U.K. revealed that children view the "very best thing in the world" as being...
A recent poll in the U.K. revealed that children view the "very best thing in the world" as being...

Bullycide: What is It and How Can It Be Prevented?
Disclaimer: This article expresses my opinion that has been formed by personal experience and...
Disclaimer: This article expresses my opinion that has been formed by personal experience and...

Teaching Children a Love of History
Parents and grandparents are responsible for teaching children a love of history. To begin, relate...
Parents and grandparents are responsible for teaching children a love of history. To begin, relate...