Woodbridge High School
Rating
Not Available
Not Available

No Reviews Yet
Find Old Friends From Woodbridge High School
Use the form below to search for alumni from Woodbridge High School.
School Description
School Summary and Highlights
- Enrolls 2,119 high school students from grades 9-12
- Ranks 29th out of 1,197 high schools in CA.
- 2010 Overall School AYP Met Status: Yes
School District Details
- Irvine Unified School District
- Per-Pupil Spending: $8,512
- Graduation Rate: 99.6%
- Dropout Rate: 0.7%
- Students Per Teacher: 26.1
- Enrolled Students: 26,776
Faculty Details and Student Enrollment
Students and Faculty
- Total Students Enrolled: 2,119
- Total Full Time "Equivalent" Teachers: 80.0
- Average Student-To-Teacher Ratio: 26.5
Students Gender Breakdown
- Males: 1,054 (49.7%)
- Females: 1,065 (50.3%)
Free Lunch Student Eligibility Breakdown
- Eligible for Reduced Lunch: 55 (2.6%)
- Eligible for Free Lunch: 131 (6.2%)
- Eligible for Either Reduced or Free Lunch: 186 (8.8%)
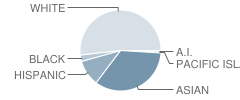
Student Enrollment Distribution by Race / Ethnicity
| Number | Percent | |
|---|---|---|
| American Indian | 15 | 0.7% |
| Black | 55 | 2.6% |
| Asian | 693 | 32.7% |
| Hispanic | 211 | 10.0% |
| White | 1,044 | 49.3% |
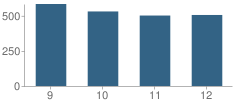
Number of Students Per Grade
| Number | Percent | |
|---|---|---|
| 9th Grade | 583 | 27.5% |
| 10th Grade | 530 | 25.0% |
| 11th Grade | 501 | 23.6% |
| 12th Grade | 505 | 23.8% |
Graduates Information (2010)
Graduation Rate
School:
98.9%
District:
97.3%
State:
78.6%
Teacher Education Background (2009)
Percent With Master's Degree
School:
2.0%
District:
4.0%
Percent With Bachelor's Degree
School:
17.2%
District:
24.8%
Teacher Credentials & Experience (2009)
Percent of Teachers With Credentials: 100.0%
Number of Certificated Staff: 99.0
Average Number of Years of Teacher Experience: 17.5
Average Age
School:
44.4
District:
46.9
Source: CA Department of Education, Source: NCES 2009-2010
School Ratings and Reviews
Be The First To Review Woodbridge High School!
School Map and Similar Schools Nearby
Click to Activate Map of Nearby School Campuses
Private
Public
This School
Similar Schools Nearby
| University High School 9-12 | 2,447 Students | 1.9 miles away | Not Yet Rated | |
| Irvine High School 9-12 | 1,894 Students | 2.2 miles away |  5 out of 5 | |
| Arnold O. Beckman High School 9-12 | 2,208 Students | 3.1 miles away | Not Yet Rated | |
| Tustin High School 9-12 | 2,132 Students | 4.0 miles away | Not Yet Rated | |
| Occs:chep / Pchs School KG-12 | 1,422 Students | 4.3 miles away | Not Yet Rated | |
| Century High School 9-12 | 2,377 Students | 4.3 miles away | Not Yet Rated | |
| Saddleback High School 9-12 | 2,115 Students | 4.5 miles away |  3.5 out of 5 | |
| Northwood High School 9-12 | 2,025 Students | 4.7 miles away | Not Yet Rated | |
| Corona Del Mar High School 7-12 | 2,342 Students | 5.2 miles away | Not Yet Rated | |
| Segerstrom High School 9-12 | 2,408 Students | 5.4 miles away | 5 out of 5 | |
Compare This School To Nearby Schools ->
School Community Forum

Join a discussion about Woodbridge High School and talk to others in the community including students, parents, teachers, and administrators.
Popular Discussion Topics
- Admissions and Registration Questions (e.g. Dress Code and Discipline Policy)
- School Calendar and Upcoming Events (e.g. Graduation)
- After School Programs, Extracurricular Activities, and Athletics (e.g. Football)
- News and Announcements (e.g. Yearbook and Class Supply List Details)
- Graduate and Alumni Events (e.g. Organizing Class Reunions)
Navigation
Can't Find What You Are Looking For?
Rankings
Nearby Cities
Sponsored Links
K-12 Articles

Helping Young Children with Printing and Cursive Writing
Is your child experiencing difficulty printing or writing? Is he unable to print or write legibly,...
Is your child experiencing difficulty printing or writing? Is he unable to print or write legibly,...

Teaching Your Kids About Respect, Values and Violence
These days it seems that every newscast reports at least once incident of violence. As parents, we...
These days it seems that every newscast reports at least once incident of violence. As parents, we...

Public or Private?
Daniel attended private school until sixth grade, when he was diagnosed with Asperger's Syndrome, a...
Daniel attended private school until sixth grade, when he was diagnosed with Asperger's Syndrome, a...