Kern County Special Education School
1300 17th St City Centre, Bakersfield, CA 93301 | (661) 636-4791
- Grades: KG-12
- Student Enrollment: 538
Rating
Not Available
Not Available

No Reviews Yet
Find Old Friends From Kern County Special Education School
Use the form below to search for alumni from Kern County Special Education School.
School Description
School Summary and Highlights
- Enrolls 538 elementary, middle, and high school students from grades KG-12
- 2010 Overall School AYP Met Status: No
Additional Contact Information
- Mailing Address: 1300 17th St., City Centre, Bakersfield, CA 93301
School Operational Details
- Special Education School
School District Details
- Kern County Office of Education School District
- Per-Pupil Spending: $42,182
- Graduation Rate: 87.9%
- Dropout Rate: 59.3%
- Students Per Teacher: 13.3
- Enrolled Students: 3,658
Faculty Details and Student Enrollment
Students and Faculty
- Total Students Enrolled: 538
- Total Full Time "Equivalent" Teachers: 94.4
- Average Student-To-Teacher Ratio: 5.7
Students Gender Breakdown
- Males: 377 (70.1%)
- Females: 161 (29.9%)
Free Lunch Student Eligibility Breakdown
- Eligible for Reduced Lunch: 22 (4.1%)
- Eligible for Free Lunch: 29 (5.4%)
- Eligible for Either Reduced or Free Lunch: 51 (9.5%)
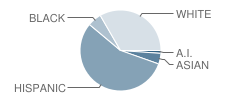
Student Enrollment Distribution by Race / Ethnicity
| Number | Percent | |
|---|---|---|
| American Indian | 6 | 1.1% |
| Black | 30 | 5.6% |
| Asian | 23 | 4.3% |
| Hispanic | 299 | 55.6% |
| White | 179 | 33.3% |
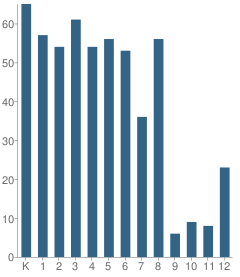
Number of Students Per Grade
| Number | Percent | |
|---|---|---|
| Kindergarten | 65 | 12.1% |
| 1st Grade | 57 | 10.6% |
| 2nd Grade | 54 | 10.0% |
| 3rd Grade | 61 | 11.3% |
| 4th Grade | 54 | 10.0% |
| 5th Grade | 56 | 10.4% |
| 6th Grade | 53 | 9.9% |
| 7th Grade | 36 | 6.7% |
| 8th Grade | 56 | 10.4% |
| 9th Grade | 6 | 1.1% |
| 10th Grade | 9 | 1.7% |
| 11th Grade | 8 | 1.5% |
| 12th Grade | 23 | 4.3% |
Teacher Education Background (2009)
Percent With Ph.D.
School:
1.2%
District:
17.0%
Percent With Master's Degree
School:
27.8%
District:
27.7%
Percent With Bachelor's Degree
School:
34.3%
District:
2.1%
Teacher Credentials & Experience (2009)
Percent of Teachers With Emergency Credentials: 3.3%
Percent of Teachers With Credentials: 50.5%
Number of Certificated Staff: 169.0
Average Number of Years of Teacher Experience: 9.7
Average Age
School:
43.8
District:
52.5
Source: CA Department of Education, Source: NCES 2009-2010
School Ratings and Reviews
Be The First To Review Kern County Special Education School!
School Community Forum

Join a discussion about Kern County Special Education School and talk to others in the community including students, parents, teachers, and administrators.
Popular Discussion Topics
- Admissions and Registration Questions (e.g. Dress Code and Discipline Policy)
- School Calendar and Upcoming Events (e.g. Graduation)
- After School Programs, Extracurricular Activities, and Athletics (e.g. Football)
- News and Announcements (e.g. Yearbook and Class Supply List Details)
- Graduate and Alumni Events (e.g. Organizing Class Reunions)
Navigation
Can't Find What You Are Looking For?
Rankings
Nearby Cities
Sponsored Links
K-12 Articles

Helping Young Children with Printing and Cursive Writing
Is your child experiencing difficulty printing or writing? Is he unable to print or write legibly,...
Is your child experiencing difficulty printing or writing? Is he unable to print or write legibly,...

Teaching Kids to Deal with Peer Pressure
Parents usually become very concerned when they hear the term "peer pressure." However, peer...
Parents usually become very concerned when they hear the term "peer pressure." However, peer...

Homework Tips: Taking the Work out of Homework
Kids hate homework. It seems that almost every night of the week they are overloaded with...
Kids hate homework. It seems that almost every night of the week they are overloaded with...