Monterey County Home Charter School

No Reviews Yet
Find Old Friends From Monterey County Home Charter School
Use the form below to search for alumni from Monterey County Home Charter School.
School Description
School Summary and Highlights
- Enrolls 419 elementary, middle, and high school students from grades KG-12
- Ranks 893rd out of 1,197 high schools in CA.
- 2010 Overall School AYP Met Status: No
Additional Contact Information
- Mailing Address: PO Box 80851, Salinas, CA 93912
School Operational Details
- Charter School
School District Details
- Monterey County Office of Education School District
- Per-Pupil Spending: $65,653
- Graduation Rate: 29.2%
- Dropout Rate: 38.5%
- Students Per Teacher: 11.8
- Enrolled Students: 1,753
Faculty Details and Student Enrollment
Students and Faculty
- Total Students Enrolled: 419
- Total Full Time "Equivalent" Teachers: 17.0
- Average Student-To-Teacher Ratio: 24.7
Students Gender Breakdown
- Males: 194 (46.3%)
- Females: 225 (53.7%)
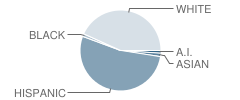
Student Enrollment Distribution by Race / Ethnicity

| Number | Percent | |
|---|---|---|
| American Indian | 4 | 1.0% |
| Black | 4 | 1.0% |
| Asian | 5 | 1.2% |
| Hispanic | 197 | 47.0% |
| White | 160 | 38.2% |
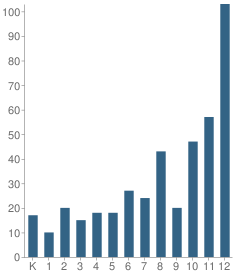
Number of Students Per Grade

| Number | Percent | |
|---|---|---|
| Kindergarten | 17 | 4.1% |
| 1st Grade | 10 | 2.4% |
| 2nd Grade | 20 | 4.8% |
| 3rd Grade | 15 | 3.6% |
| 4th Grade | 18 | 4.3% |
| 5th Grade | 18 | 4.3% |
| 6th Grade | 27 | 6.4% |
| 7th Grade | 24 | 5.7% |
| 8th Grade | 43 | 10.3% |
| 9th Grade | 20 | 4.8% |
| 10th Grade | 47 | 11.2% |
| 11th Grade | 57 | 13.6% |
| 12th Grade | 103 | 24.6% |
Graduates Information (2010)
Graduation Rate
School:
67.0%
District:
81.6%
State:
78.6%
Teacher Education Background (2009)
Percent With Master's Degree
School:
4.3%
District:
21.2%
Teacher Credentials & Experience (2009)
Percent of Teachers With Credentials: 100.0%
Number of Certificated Staff: 23.0
Average Number of Years of Teacher Experience: 15.7
Average Age
School:
48.1
District:
51.9
Source: CA Department of Education, Source: NCES 2009-2010
School Ratings and Reviews
Be The First To Review Monterey County Home Charter School!
Sponsored Links
Test Scores and Performance Information
Overall School Rating
How is this determined?
The overall school rating shows that Monterey County Home Charter School performed on average worse than many other schools across the state on CST state exams in the following subjects:
- CST Algebra I
- CST Earth Science
- CST English-Language Arts
- CST General Mathematics
- CST History - Social Science
- CST Mathematics
- CST Science
- CST U.S. History
- CST World History
AYP Results (2010)
Overall AYP Met: No
ELA AYP Met: No
Math AYP Met: No
SAT Exam Results (2009)
Percent of Students Taking SAT Exam: 10.0%
CST - Test Proficiency by Grade and Subject
Grade 3 - % of students at or above proficiency
| School | District | State | |
|---|---|---|---|
| CST English-Language Arts Test | |||
| 2010 | 17.0% | 14.0% | 43.0% |
| 2009 | 65.0% | 58.0% | 44.0% |
| 2008 | 14.0% | 16.0% | 38.0% |
| CST Mathematics Test | |||
| 2010 | 25.0% | 23.0% | 65.0% |
| 2009 | 53.0% | 47.0% | 64.0% |
| 2008 | 15.0% | 17.0% | 61.0% |
Grade 4 - % of students at or above proficiency
| School | District | State | |
|---|---|---|---|
| CST English-Language Arts Test | |||
| 2010 | 50.0% | 45.0% | 63.0% |
| 2009 | 45.0% | 43.0% | 61.0% |
| 2008 | 50.0% | 45.0% | 55.0% |
| CST Mathematics Test | |||
| 2010 | 22.0% | 20.0% | 68.0% |
| 2009 | 30.0% | 32.0% | 66.0% |
| 2008 | 38.0% | 37.0% | 61.0% |
Grade 5 - % of students at or above proficiency
| School | District | State | |
|---|---|---|---|
| CST English-Language Arts Test | |||
| 2010 | 50.0% | 41.0% | 58.0% |
| 2009 | 53.0% | 43.0% | 54.0% |
| 2008 | 44.0% | 38.0% | 48.0% |
| CST Mathematics Test | |||
| 2010 | 12.0% | 14.0% | 61.0% |
| 2009 | 41.0% | 34.0% | 57.0% |
| 2008 | 22.0% | 20.0% | 51.0% |
| CST Science Test | |||
| 2010 | 41.0% | 33.0% | 56.0% |
| 2009 | 53.0% | 41.0% | 49.0% |
| 2008 | 44.0% | 36.0% | 46.0% |
Grade 6 - % of students at or above proficiency
| School | District | State | |
|---|---|---|---|
| CST English-Language Arts Test | |||
| 2010 | 62.0% | 43.0% | 55.0% |
| 2009 | 53.0% | 50.0% | 52.0% |
| 2008 | 47.0% | 30.0% | 47.0% |
| CST Mathematics Test | |||
| 2010 | 38.0% | 27.0% | 52.0% |
| 2009 | 32.0% | 28.0% | 49.0% |
| 2008 | 36.0% | 25.0% | 44.0% |
Grade 7 - % of students at or above proficiency
| School | District | State | |
|---|---|---|---|
| CST English-Language Arts Test | |||
| 2010 | 52.0% | 39.0% | 55.0% |
| 2009 | 41.0% | 32.0% | 54.0% |
| 2008 | 63.0% | 48.0% | 49.0% |
| CST Mathematics Test | |||
| 2010 | 22.0% | 17.0% | 48.0% |
| 2009 | 10.0% | 7.0% | 43.0% |
| 2008 | 28.0% | 22.0% | 41.0% |
Grade 8 - % of students at or above proficiency
| School | District | State | |
|---|---|---|---|
| CST English-Language Arts Test | |||
| 2010 | 37.0% | 20.0% | 54.0% |
| 2009 | 57.0% | 31.0% | 48.0% |
| 2008 | 37.0% | 25.0% | 45.0% |
| CST General Mathematics Test | |||
| 2010 | 19.0% | 10.0% | 30.0% |
| 2009 | 28.0% | 13.0% | 30.0% |
| 2008 | 23.0% | 12.0% | 31.0% |
| CST History - Social Science Test | |||
| 2010 | 23.0% | 13.0% | 47.0% |
| 2009 | 28.0% | 17.0% | 42.0% |
| 2008 | 29.0% | 17.0% | 36.0% |
| CST Science Test | |||
| 2010 | 31.0% | 21.0% | 59.0% |
| 2009 | 52.0% | 30.0% | 56.0% |
| 2008 | 37.0% | 22.0% | 52.0% |
Grade 9 - % of students at or above proficiency
| School | District | State | |
|---|---|---|---|
| CST Algebra I Test | |||
| 2010 | 23.0% | 23.0% | 22.0% |
| 2009 | 8.0% | 8.0% | 21.0% |
| 2008 | 19.0% | 15.0% | 18.0% |
| CST Earth Science Test | |||
| 2010 | 47.0% | 47.0% | 35.0% |
| 2009 | 16.0% | 16.0% | 29.0% |
| 2008 | 32.0% | 30.0% | 31.0% |
| CST English-Language Arts Test | |||
| 2010 | 41.0% | 20.0% | 54.0% |
| 2009 | 36.0% | 18.0% | 50.0% |
| 2008 | 38.0% | 16.0% | 49.0% |
| CST General Mathematics Test | |||
| 2010 | 16.0% | 12.0% | 17.0% |
| 2009 | 11.0% | 9.0% | 17.0% |
| 2008 | 23.0% | 12.0% | 18.0% |
| CST World History Test | |||
| 2010 | 21.0% | 20.0% | 45.0% |
| 2009 | 28.0% | 22.0% | 41.0% |
| 2008 | 9.0% | 9.0% | 36.0% |
Grade 10 - % of students at or above proficiency
| School | District | State | |
|---|---|---|---|
| CST Algebra I Test | |||
| 2010 | 11.0% | 10.0% | 12.0% |
| 2009 | 9.0% | 9.0% | 11.0% |
| 2008 | 5.0% | 4.0% | 9.0% |
| CST Earth Science Test | |||
| 2010 | 33.0% | 31.0% | 29.0% |
| 2009 | 27.0% | 27.0% | 23.0% |
| 2008 | 25.0% | 29.0% | 23.0% |
| CST English-Language Arts Test | |||
| 2010 | 24.0% | 12.0% | 45.0% |
| 2009 | 28.0% | 13.0% | 44.0% |
| 2008 | 33.0% | 13.0% | 41.0% |
| CST Science Test | |||
| 2010 | 15.0% | 10.0% | 46.0% |
| 2009 | 20.0% | 9.0% | 44.0% |
| 2008 | 17.0% | 6.0% | 40.0% |
| CST World History Test | |||
| 2010 | 5.0% | 5.0% | 42.0% |
| 2009 | 15.0% | 9.0% | 38.0% |
| 2008 | 12.0% | 12.0% | 33.0% |
Grade 11 - % of students at or above proficiency
| School | District | State | |
|---|---|---|---|
| CST English-Language Arts Test | |||
| 2010 | 25.0% | 12.0% | 42.0% |
| 2009 | 25.0% | 9.0% | 40.0% |
| 2008 | 29.0% | 12.0% | 37.0% |
| CST U.S. History Test | |||
| 2010 | 15.0% | 8.0% | 45.0% |
| 2009 | 11.0% | 6.0% | 44.0% |
| 2008 | 16.0% | 5.0% | 38.0% |
End of Course - % of students at or above proficiency
| School | District | State | |
|---|---|---|---|
| CST Algebra I Test | |||
| 2010 | 12.0% | 12.0% | 31.0% |
| 2009 | 14.0% | 13.0% | 28.0% |
| 2008 | 12.0% | 9.0% | 25.0% |
| CST Earth Science Test | |||
| 2010 | 38.0% | 37.0% | 33.0% |
| 2009 | 20.0% | 20.0% | 28.0% |
| 2008 | 29.0% | 29.0% | 28.0% |
| CST General Mathematics Test | |||
| 2010 | 17.0% | 11.0% | 27.0% |
| 2009 | 18.0% | 11.0% | 26.0% |
| 2008 | 23.0% | 12.0% | 27.0% |
| CST World History Test | |||
| 2010 | 15.0% | 15.0% | 41.0% |
| 2009 | 20.0% | 13.0% | 38.0% |
| 2008 | 10.0% | 8.0% | 33.0% |
Grade 2 - % of students at or above proficiency
| School | District | State | |
|---|---|---|---|
| CST English-Language Arts Test | |||
| 2008 | 56.0% | 50.0% | 48.0% |
| CST Mathematics Test | |||
| 2008 | 44.0% | 39.0% | 59.0% |
Source: CA Department of Education 2009-2010
School Map and Similar Schools Nearby
Click to Activate Map of Nearby School Campuses
Private
Public
This School
Similar Schools Nearby
| Learning for Life Charter School 7-12 | 114 Students | 8.7 miles away | ![]() 1 out of 5 | |
| Big Sur Charter School KG-12 | 36 Students | 27.8 miles away | Not Yet Rated | - |
Compare This School To Nearby Schools ->
School Community Forum

Join a discussion about Monterey County Home Charter School and talk to others in the community including students, parents, teachers, and administrators.
Popular Discussion Topics
- Admissions and Registration Questions (e.g. Dress Code and Discipline Policy)
- School Calendar and Upcoming Events (e.g. Graduation)
- After School Programs, Extracurricular Activities, and Athletics (e.g. Football)
- News and Announcements (e.g. Yearbook and Class Supply List Details)
- Graduate and Alumni Events (e.g. Organizing Class Reunions)
Navigation
Can't Find What You Are Looking For?
Rankings
Nearby Cities
Sponsored Links
K-12 Articles
The Most Used Form of Communication
Writing has, quite surprisingly, become more and more important in today's electronic society....
Summer Reading
In 1998, a book was published in the US that turned a hatred of reading to love. "Harry Potter and...
Teaching Children Respect
Statistics prove that there are many different family types in today's society. Grandparents or a...

