Occs:chep / Pchs School

No Reviews Yet
Find Old Friends From Occs:chep / Pchs School
Use the form below to search for alumni from Occs:chep / Pchs School.
School Description
School Summary and Highlights
- Enrolls 1,422 elementary, middle, and high school students from grades KG-12
- Ranks 335th out of 1,197 high schools in CA.
- 2010 Overall School AYP Met Status: No
Additional Contact Information
- Mailing Address: 2910 Redhill Ave., Ste. 200, Costa Mesa, CA 92626
School District Details
- Orange County Department of Education School District
- Per-Pupil Spending: $23,424
- Graduation Rate: 99.9%
- Dropout Rate: 33.0%
- Students Per Teacher: 22.5
- Enrolled Students: 7,717
Faculty Details and Student Enrollment
Students and Faculty
- Total Students Enrolled: 1,422
- Total Full Time "Equivalent" Teachers: 41.7
- Average Student-To-Teacher Ratio: 34.1
Students Gender Breakdown
- Males: 728 (51.2%)
- Females: 694 (48.8%)
Free Lunch Student Eligibility Breakdown
- Eligible for Reduced Lunch: - (-)
- Eligible for Free Lunch: 74 (5.2%)
- Eligible for Either Reduced or Free Lunch: 74 (5.2%)
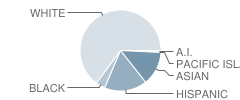
Student Enrollment Distribution by Race / Ethnicity

| Number | Percent | |
|---|---|---|
| American Indian | 8 | 0.6% |
| Black | 49 | 3.4% |
| Asian | 175 | 12.3% |
| Hispanic | 219 | 15.4% |
| White | 829 | 58.3% |
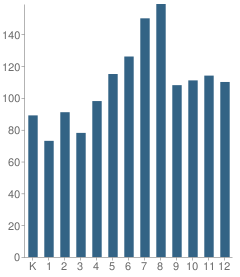
Number of Students Per Grade

| Number | Percent | |
|---|---|---|
| Kindergarten | 89 | 6.3% |
| 1st Grade | 73 | 5.1% |
| 2nd Grade | 91 | 6.4% |
| 3rd Grade | 78 | 5.5% |
| 4th Grade | 98 | 6.9% |
| 5th Grade | 115 | 8.1% |
| 6th Grade | 126 | 8.9% |
| 7th Grade | 150 | 10.5% |
| 8th Grade | 159 | 11.2% |
| 9th Grade | 108 | 7.6% |
| 10th Grade | 111 | 7.8% |
| 11th Grade | 114 | 8.0% |
| 12th Grade | 110 | 7.7% |
Graduates Information (2010)
Graduation Rate
School:
87.9%
District:
87.9%
State:
78.6%
Teacher Education Background (2009)
Percent With Ph.D.
School:
2.0%
District:
24.3%
Percent With Master's Degree
School:
22.0%
District:
25.7%
Percent With Bachelor's Degree
School:
2.0%
District:
2.9%
Teacher Credentials & Experience (2009)
Percent of Teachers With Credentials: 100.0%
Number of Certificated Staff: 50.0
Average Number of Years of Teacher Experience: 20.4
Average Age
School:
53.4
District:
52.8
Source: CA Department of Education, Source: NCES 2009-2010
School Ratings and Reviews
Be The First To Review Occs:chep / Pchs School!
Sponsored Links
Test Scores and Performance Information
Overall School Rating
How is this determined?
The overall school rating shows that Occs:chep / Pchs School performed on average about the same as other schools across the state on CST state exams in the following subjects:
- CST Algebra I
- CST Algebra II
- CST Biology
- CST Earth Science
- CST English-Language Arts
- CST General Mathematics
- CST Geometry
- CST History - Social Science
- CST Mathematics
- CST Science
- CST Summative High School Math
- CST U.S. History
- CST World History
AYP Results (2010)
Overall AYP Met: No
ELA AYP Met: No
Math AYP Met: No
SAT Exam Results (2009)
Percent of Students Taking SAT Exam: 28.3%
Average Combined Score: 1,661.4
Critical Reading Average: 573.6
Math Average: 541.1
Writing Average: 546.8
Percent Scoring At or Above 1500: 71.4%
CST - Test Proficiency by Grade and Subject
Grade 2 - % of students at or above proficiency
| School | District | State | |
|---|---|---|---|
| CST English-Language Arts Test | |||
| 2010 | 60.0% | 50.0% | 53.0% |
| 2009 | 44.0% | 42.0% | 53.0% |
| 2008 | 46.0% | 43.0% | 48.0% |
| CST Mathematics Test | |||
| 2010 | 65.0% | 58.0% | 62.0% |
| 2009 | 48.0% | 47.0% | 63.0% |
| 2008 | 50.0% | 46.0% | 59.0% |
Grade 3 - % of students at or above proficiency
| School | District | State | |
|---|---|---|---|
| CST English-Language Arts Test | |||
| 2010 | 46.0% | 40.0% | 43.0% |
| 2009 | 49.0% | 45.0% | 44.0% |
| 2008 | 48.0% | 43.0% | 38.0% |
| CST Mathematics Test | |||
| 2010 | 50.0% | 46.0% | 65.0% |
| 2009 | 61.0% | 57.0% | 64.0% |
| 2008 | 49.0% | 45.0% | 61.0% |
Grade 4 - % of students at or above proficiency
| School | District | State | |
|---|---|---|---|
| CST English-Language Arts Test | |||
| 2010 | 74.0% | 69.0% | 63.0% |
| 2009 | 73.0% | 68.0% | 61.0% |
| 2008 | 68.0% | 62.0% | 55.0% |
| CST Mathematics Test | |||
| 2010 | 65.0% | 59.0% | 68.0% |
| 2009 | 68.0% | 63.0% | 66.0% |
| 2008 | 61.0% | 53.0% | 61.0% |
Grade 5 - % of students at or above proficiency
| School | District | State | |
|---|---|---|---|
| CST English-Language Arts Test | |||
| 2010 | 73.0% | 69.0% | 58.0% |
| 2009 | 65.0% | 57.0% | 54.0% |
| 2008 | 67.0% | 58.0% | 48.0% |
| CST Mathematics Test | |||
| 2010 | 50.0% | 47.0% | 61.0% |
| 2009 | 57.0% | 48.0% | 57.0% |
| 2008 | 55.0% | 49.0% | 51.0% |
| CST Science Test | |||
| 2010 | 71.0% | 65.0% | 56.0% |
| 2009 | 63.0% | 55.0% | 49.0% |
| 2008 | 64.0% | 58.0% | 46.0% |
Grade 6 - % of students at or above proficiency
| School | District | State | |
|---|---|---|---|
| CST English-Language Arts Test | |||
| 2010 | 68.0% | 58.0% | 55.0% |
| 2009 | 62.0% | 54.0% | 52.0% |
| 2008 | 59.0% | 47.0% | 47.0% |
| CST Mathematics Test | |||
| 2010 | 56.0% | 47.0% | 52.0% |
| 2009 | 52.0% | 44.0% | 49.0% |
| 2008 | 46.0% | 36.0% | 44.0% |
Grade 7 - % of students at or above proficiency
| School | District | State | |
|---|---|---|---|
| CST English-Language Arts Test | |||
| 2010 | 77.0% | 49.0% | 55.0% |
| 2009 | 70.0% | 40.0% | 54.0% |
| 2008 | 66.0% | 31.0% | 49.0% |
| CST Mathematics Test | |||
| 2010 | 51.0% | 31.0% | 48.0% |
| 2009 | 49.0% | 25.0% | 43.0% |
| 2008 | 48.0% | 23.0% | 41.0% |
| CST Algebra I Test | |||
| 2008 | 75.0% | 72.0% | 80.0% |
Grade 8 - % of students at or above proficiency
| School | District | State | |
|---|---|---|---|
| CST Algebra I Test | |||
| 2010 | 53.0% | 56.0% | 46.0% |
| 2009 | 43.0% | 43.0% | 44.0% |
| 2008 | 32.0% | 34.0% | 42.0% |
| CST English-Language Arts Test | |||
| 2010 | 69.0% | 28.0% | 54.0% |
| 2009 | 69.0% | 23.0% | 48.0% |
| 2008 | 62.0% | 21.0% | 45.0% |
| CST General Mathematics Test | |||
| 2010 | 36.0% | 14.0% | 30.0% |
| 2009 | 23.0% | 11.0% | 30.0% |
| 2008 | 42.0% | 12.0% | 31.0% |
| CST History - Social Science Test | |||
| 2010 | 55.0% | 22.0% | 47.0% |
| 2009 | 58.0% | 20.0% | 42.0% |
| 2008 | 45.0% | 15.0% | 36.0% |
| CST Science Test | |||
| 2010 | 58.0% | 24.0% | 59.0% |
| 2009 | 61.0% | 23.0% | 56.0% |
| 2008 | 53.0% | 19.0% | 52.0% |
Grade 9 - % of students at or above proficiency
| School | District | State | |
|---|---|---|---|
| CST Algebra I Test | |||
| 2010 | 16.0% | 10.0% | 22.0% |
| 2009 | 20.0% | 11.0% | 21.0% |
| 2008 | 9.0% | 6.0% | 18.0% |
| CST Earth Science Test | |||
| 2010 | 56.0% | 39.0% | 35.0% |
| 2009 | 58.0% | 34.0% | 29.0% |
| CST English-Language Arts Test | |||
| 2010 | 74.0% | 20.0% | 54.0% |
| 2009 | 82.0% | 20.0% | 50.0% |
| 2008 | 75.0% | 19.0% | 49.0% |
| CST General Mathematics Test | |||
| 2010 | 31.0% | 11.0% | 17.0% |
| 2009 | 39.0% | 12.0% | 17.0% |
| 2008 | 46.0% | 15.0% | 18.0% |
| CST Geometry Test | |||
| 2010 | 43.0% | 47.0% | 46.0% |
| 2009 | 25.0% | 27.0% | 47.0% |
| 2008 | 30.0% | 28.0% | 43.0% |
Grade 10 - % of students at or above proficiency
| School | District | State | |
|---|---|---|---|
| CST Algebra I Test | |||
| 2010 | 19.0% | 4.0% | 12.0% |
| 2009 | 15.0% | 5.0% | 11.0% |
| 2008 | 5.0% | 5.0% | 9.0% |
| CST Biology Test | |||
| 2010 | 61.0% | 55.0% | 38.0% |
| 2009 | 40.0% | 38.0% | 34.0% |
| 2008 | 59.0% | 44.0% | 35.0% |
| CST Earth Science Test | |||
| 2010 | 63.0% | 32.0% | 29.0% |
| 2009 | 68.0% | 22.0% | 23.0% |
| CST English-Language Arts Test | |||
| 2010 | 81.0% | 19.0% | 45.0% |
| 2009 | 72.0% | 18.0% | 44.0% |
| 2008 | 62.0% | 16.0% | 41.0% |
| CST Geometry Test | |||
| 2010 | 5.0% | 7.0% | 14.0% |
| 2009 | 6.0% | 7.0% | 14.0% |
| 2008 | 7.0% | 10.0% | 12.0% |
| CST Science Test | |||
| 2010 | 66.0% | 17.0% | 46.0% |
| 2009 | 55.0% | 15.0% | 44.0% |
| 2008 | 54.0% | 14.0% | 40.0% |
| CST World History Test | |||
| 2010 | 57.0% | 43.0% | 42.0% |
| 2009 | 36.0% | 16.0% | 38.0% |
| 2008 | 37.0% | 16.0% | 33.0% |
| CST Algebra II Test | |||
| 2009 | 19.0% | 25.0% | 37.0% |
| 2008 | 15.0% | 19.0% | 36.0% |
Grade 11 - % of students at or above proficiency
| School | District | State | |
|---|---|---|---|
| CST Algebra II Test | |||
| 2010 | 3.0% | 3.0% | 14.0% |
| 2009 | - | - | - |
| 2008 | 4.0% | 3.0% | 11.0% |
| CST Biology Test | |||
| 2010 | 47.0% | 47.0% | 46.0% |
| 2009 | - | - | - |
| 2008 | 58.0% | 36.0% | 39.0% |
| CST Earth Science Test | |||
| 2010 | 43.0% | 33.0% | 32.0% |
| 2009 | 71.0% | 15.0% | 26.0% |
| CST English-Language Arts Test | |||
| 2010 | 60.0% | 15.0% | 42.0% |
| 2009 | 57.0% | 13.0% | 40.0% |
| 2008 | 65.0% | 14.0% | 37.0% |
| CST Geometry Test | |||
| 2010 | 5.0% | 3.0% | 6.0% |
| CST Summative High School Math Test | |||
| 2010 | 31.0% | 40.0% | 50.0% |
| 2009 | 42.0% | 40.0% | 47.0% |
| 2008 | 33.0% | 33.0% | 43.0% |
| CST U.S. History Test | |||
| 2010 | 39.0% | 11.0% | 45.0% |
| 2009 | 39.0% | 12.0% | 44.0% |
| 2008 | 44.0% | 10.0% | 38.0% |
| CST Algebra I Test | |||
| 2009 | 4.0% | 5.0% | 8.0% |
| 2008 | 18.0% | 4.0% | 5.0% |
End of Course - % of students at or above proficiency
| School | District | State | |
|---|---|---|---|
| CST Algebra I Test | |||
| 2010 | 32.0% | 16.0% | 31.0% |
| 2009 | 27.0% | 10.0% | 28.0% |
| 2008 | 24.0% | 9.0% | 25.0% |
| CST Algebra II Test | |||
| 2010 | 8.0% | 10.0% | 31.0% |
| 2009 | 11.0% | 13.0% | 28.0% |
| 2008 | 8.0% | 9.0% | 27.0% |
| CST Biology Test | |||
| 2010 | 58.0% | 53.0% | 46.0% |
| 2009 | 44.0% | 34.0% | 42.0% |
| 2008 | 59.0% | 39.0% | 42.0% |
| CST Earth Science Test | |||
| 2010 | 55.0% | 37.0% | 33.0% |
| 2009 | 62.0% | 25.0% | 28.0% |
| CST General Mathematics Test | |||
| 2010 | 34.0% | 12.0% | 27.0% |
| 2009 | 28.0% | 12.0% | 26.0% |
| 2008 | 43.0% | 14.0% | 27.0% |
| CST Geometry Test | |||
| 2010 | 20.0% | 21.0% | 27.0% |
| 2009 | 20.0% | 17.0% | 26.0% |
| 2008 | 14.0% | 12.0% | 24.0% |
| CST Summative High School Math Test | |||
| 2010 | 39.0% | 45.0% | 54.0% |
| 2009 | 48.0% | 45.0% | 50.0% |
| 2008 | 28.0% | 28.0% | 47.0% |
| CST World History Test | |||
| 2010 | 56.0% | 36.0% | 41.0% |
| 2009 | 37.0% | 12.0% | 38.0% |
| 2008 | 37.0% | 11.0% | 33.0% |
Source: CA Department of Education 2009-2010
School Map and Similar Schools Nearby
Click to Activate Map of Nearby School Campuses
Private
Public
This School
Similar Schools Nearby
| Costa Mesa High School 7-12 | 1,752 Students | 1.5 miles away | Not Yet Rated | |
| Corona Del Mar High School 7-12 | 2,342 Students | 2.3 miles away | Not Yet Rated | |
| Segerstrom High School 9-12 | 2,408 Students | 2.5 miles away | ![]() 5 out of 5 | |
| Saddleback High School 9-12 | 2,115 Students | 2.9 miles away | ![]() 3.5 out of 5 | |
| Estancia High School 9-12 | 1,385 Students | 3.3 miles away | ![]() 3 out of 5 | |
| University High School 9-12 | 2,447 Students | 3.4 miles away | Not Yet Rated | |
| Newport Harbor High School 9-12 | 2,483 Students | 3.6 miles away | ![]() 5 out of 5 | |
| Valley High School 9-12 | 2,465 Students | 3.9 miles away | ![]() 5 out of 5 | |
| Hector G. Godinez School 9-12 | 2,172 Students | 4.2 miles away | Not Yet Rated | - |
| Woodbridge High School 9-12 | 2,119 Students | 4.3 miles away | Not Yet Rated | |
Compare This School To Nearby Schools ->
School Community Forum

Join a discussion about Occs:chep / Pchs School and talk to others in the community including students, parents, teachers, and administrators.
Popular Discussion Topics
- Admissions and Registration Questions (e.g. Dress Code and Discipline Policy)
- School Calendar and Upcoming Events (e.g. Graduation)
- After School Programs, Extracurricular Activities, and Athletics (e.g. Football)
- News and Announcements (e.g. Yearbook and Class Supply List Details)
- Graduate and Alumni Events (e.g. Organizing Class Reunions)
Navigation
Can't Find What You Are Looking For?
Rankings
Nearby Cities
Sponsored Links
K-12 Articles
The Importance of Ninth Grade
Students who are entering ninth grade do not realize the importance of the critical decisions they...
Democracy in Action
There is still over a year until the general election, but the election cycle has been in full...
Feeling Good in Your Own Skin
Body image is a very touchy issue with today's kids. Since the 1950s, when Barbie was first...


