Access Juvenile Hall School
Rating
Not Available
Not Available

No Reviews Yet
Find Old Friends From Access Juvenile Hall School
Use the form below to search for alumni from Access Juvenile Hall School.
School Description
School Summary and Highlights
- Enrolls 918 elementary, middle, and high school students from grades KG-12
- 2010 Overall School AYP Met Status: No
Additional Contact Information
- Mailing Address: PO Box 9050, Costa Mesa, CA 92628
School Operational Details
- Alternative School
- Title I Eligible
School District Details
- Orange County Department of Education School District
- Per-Pupil Spending: $23,424
- Graduation Rate: 99.9%
- Dropout Rate: 33.0%
- Students Per Teacher: 22.5
- Enrolled Students: 7,717
Faculty Details and Student Enrollment
Students and Faculty
- Total Students Enrolled: 918
- Total Full Time "Equivalent" Teachers: 61.9
- Average Student-To-Teacher Ratio: 14.8
Students Gender Breakdown
- Males: 768 (83.7%)
- Females: 150 (16.3%)
Free Lunch Student Eligibility Breakdown
- Eligible for Reduced Lunch: - (-)
- Eligible for Free Lunch: 915 (99.7%)
- Eligible for Either Reduced or Free Lunch: 915 (99.7%)
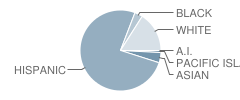
Student Enrollment Distribution by Race / Ethnicity
| Number | Percent | |
|---|---|---|
| American Indian | 1 | 0.1% |
| Black | 29 | 3.2% |
| Asian | 37 | 4.0% |
| Hispanic | 683 | 74.4% |
| White | 144 | 15.7% |
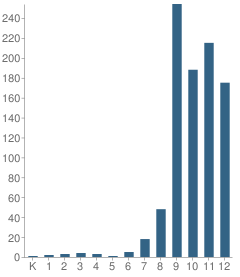
Number of Students Per Grade
| Number | Percent | |
|---|---|---|
| Kindergarten | 1 | 0.1% |
| 1st Grade | 2 | 0.2% |
| 2nd Grade | 3 | 0.3% |
| 3rd Grade | 4 | 0.4% |
| 4th Grade | 3 | 0.3% |
| 5th Grade | 1 | 0.1% |
| 6th Grade | 5 | 0.5% |
| 7th Grade | 18 | 2.0% |
| 8th Grade | 48 | 5.2% |
| 9th Grade | 254 | 27.7% |
| 10th Grade | 188 | 20.5% |
| 11th Grade | 215 | 23.4% |
| 12th Grade | 175 | 19.1% |
| Ungraded | 1 | 0.1% |
Graduates Information (2010)
Graduation Rate
School:
87.9%
District:
87.9%
State:
78.6%
Teacher Education Background (2009)
Percent With Ph.D.
School:
2.7%
District:
24.3%
Percent With Master's Degree
School:
30.0%
District:
25.7%
Percent With Bachelor's Degree
School:
7.3%
District:
2.9%
Teacher Credentials & Experience (2009)
Percent of Teachers With Emergency Credentials: 5.0%
Percent of Teachers With Credentials: 93.1%
Number of Certificated Staff: 110.0
Average Number of Years of Teacher Experience: 13.2
Average Age
School:
46.0
District:
52.8
Source: CA Department of Education, Source: NCES 2009-2010
School Ratings and Reviews
Be The First To Review Access Juvenile Hall School!
School Map and Similar Schools Nearby
Click to Activate Map of Nearby School Campuses
Private
Public
This School
Similar Schools Nearby
| Monte Vista High School 9-12 | 71 Students | 1.5 miles away | Not Yet Rated | |
| Back Bay High School 9-12 | 116 Students | 1.5 miles away | Not Yet Rated | |
| Early College High School 9-12 | 251 Students | 2.7 miles away | Not Yet Rated | |
| Cesar E. Chavez High School 9-12 | 185 Students | 3.2 miles away | Not Yet Rated | |
| Alternative Education-San Joaquin High School KG-12 | 130 Students | 3.8 miles away | Not Yet Rated | |
| Mountain View High (Continuation) School 9-12 | 257 Students | 4.3 miles away | Not Yet Rated | |
| Valley Vista High (Continuation) School 9-12 | 336 Students | 5.2 miles away | Not Yet Rated | |
| Santa Ana Community Day School 7-12 | 71 Students | 5.5 miles away | Not Yet Rated | |
| Sycamore High (Alternative) School 7-12 | 14 Students | 5.8 miles away | Not Yet Rated | |
| Middle College High School 9-12 | 322 Students | 5.8 miles away | Not Yet Rated | |
Compare This School To Nearby Schools ->
School Community Forum

Join a discussion about Access Juvenile Hall School and talk to others in the community including students, parents, teachers, and administrators.
Popular Discussion Topics
- Admissions and Registration Questions (e.g. Dress Code and Discipline Policy)
- School Calendar and Upcoming Events (e.g. Graduation)
- After School Programs, Extracurricular Activities, and Athletics (e.g. Football)
- News and Announcements (e.g. Yearbook and Class Supply List Details)
- Graduate and Alumni Events (e.g. Organizing Class Reunions)
Navigation
Can't Find What You Are Looking For?
Rankings
Nearby Cities
Sponsored Links
K-12 Articles

Middle School Homework and Study Habits
The report cards came home and you’re disappointed with your child’s scores. You know he has the...
The report cards came home and you’re disappointed with your child’s scores. You know he has the...

Summer Reading
In 1998, a book was published in the US that turned a hatred of reading to love. “Harry Potter and...
In 1998, a book was published in the US that turned a hatred of reading to love. “Harry Potter and...

The First Day of School
The first day of kindergarten is a rite of passage for any student. Every mother cries and...
The first day of kindergarten is a rite of passage for any student. Every mother cries and...