Venture Academy

No Reviews Yet
Find Old Friends From Venture Academy
Use the form below to search for alumni from Venture Academy.
School Description
School Summary and Highlights
- Enrolls 894 elementary, middle, and high school students from grades KG-12
- Ranks 1057th out of 1,197 high schools in CA.
- 2010 Overall School AYP Met Status: No
Additional Contact Information
- Mailing Address: PO Box 213030, Stockton, CA 95213
School Operational Details
- Charter School
School District Details
- San Joaquin County Office of Education School District
- Per-Pupil Spending: $37,669
- Graduation Rate: 53.3%
- Dropout Rate: 39.4%
- Students Per Teacher: 13.7
- Enrolled Students: 2,657
Faculty Details and Student Enrollment
Students and Faculty
- Total Students Enrolled: 894
- Total Full Time "Equivalent" Teachers: 41.0
- Average Student-To-Teacher Ratio: 21.8
Students Gender Breakdown
- Males: 416 (46.5%)
- Females: 478 (53.5%)
Free Lunch Student Eligibility Breakdown
- Eligible for Reduced Lunch: 82 (9.2%)
- Eligible for Free Lunch: 260 (29.1%)
- Eligible for Either Reduced or Free Lunch: 342 (38.3%)
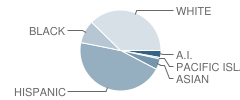
Student Enrollment Distribution by Race / Ethnicity

| Number | Percent | |
|---|---|---|
| American Indian | 27 | 3.0% |
| Black | 83 | 9.3% |
| Asian | 40 | 4.5% |
| Hispanic | 403 | 45.1% |
| White | 334 | 37.4% |
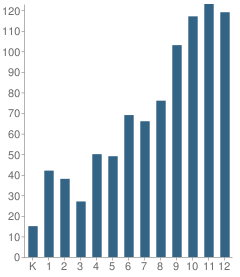
Number of Students Per Grade

| Number | Percent | |
|---|---|---|
| Kindergarten | 15 | 1.7% |
| 1st Grade | 42 | 4.7% |
| 2nd Grade | 38 | 4.3% |
| 3rd Grade | 27 | 3.0% |
| 4th Grade | 50 | 5.6% |
| 5th Grade | 49 | 5.5% |
| 6th Grade | 69 | 7.7% |
| 7th Grade | 66 | 7.4% |
| 8th Grade | 76 | 8.5% |
| 9th Grade | 103 | 11.5% |
| 10th Grade | 117 | 13.1% |
| 11th Grade | 123 | 13.8% |
| 12th Grade | 119 | 13.3% |
Graduates Information (2010)
Graduation Rate
School:
70.8%
District:
73.6%
State:
78.6%
Teacher Education Background (2009)
Percent With Ph.D.
School:
2.6%
District:
10.9%
Percent With Master's Degree
School:
10.5%
District:
30.9%
Percent With Bachelor's Degree
School:
7.9%
District:
1.8%
Teacher Credentials & Experience (2009)
Percent of Teachers With Credentials: 100.0%
Number of Certificated Staff: 38.0
Average Number of Years of Teacher Experience: 12.7
Average Age
School:
46.7
District:
48.2
Source: CA Department of Education, Source: NCES 2009-2010
School Ratings and Reviews
Be The First To Review Venture Academy!
Sponsored Links
Test Scores and Performance Information
Overall School Rating
How is this determined?
The overall school rating shows that Venture Academy performed on average worse than many other schools across the state on CST state exams in the following subjects:
- CST Algebra I
- CST Algebra II
- CST Biology
- CST Earth Science
- CST English-Language Arts
- CST Geometry
- CST History - Social Science
- CST Mathematics
- CST Science
- CST U.S. History
- CST World History
AYP Results (2010)
Overall AYP Met: No
ELA AYP Met: Yes
Math AYP Met: No
ACT Exam Results (2009)
Percent of Students Taking ACT Exam: 3.4%
SAT Exam Results (2009)
Percent of Students Taking SAT Exam: 8.0%
CST - Test Proficiency by Grade and Subject
Grade 2 - % of students at or above proficiency
| School | District | State | |
|---|---|---|---|
| CST English-Language Arts Test | |||
| 2010 | 46.0% | 11.0% | 53.0% |
| 2009 | 33.0% | - | 53.0% |
| 2008 | 60.0% | - | 48.0% |
| CST Mathematics Test | |||
| 2010 | 57.0% | 6.0% | 62.0% |
| 2009 | 53.0% | - | 63.0% |
| 2008 | 77.0% | 15.0% | 59.0% |
Grade 3 - % of students at or above proficiency
| School | District | State | |
|---|---|---|---|
| CST English-Language Arts Test | |||
| 2010 | 27.0% | - | 43.0% |
| 2009 | 24.0% | - | 44.0% |
| 2008 | 34.0% | - | 38.0% |
| CST Mathematics Test | |||
| 2010 | 38.0% | - | 65.0% |
| 2009 | 48.0% | - | 64.0% |
| 2008 | 33.0% | - | 61.0% |
Grade 4 - % of students at or above proficiency
| School | District | State | |
|---|---|---|---|
| CST English-Language Arts Test | |||
| 2010 | 45.0% | 9.0% | 63.0% |
| 2009 | 42.0% | - | 61.0% |
| 2008 | 35.0% | 14.0% | 55.0% |
| CST Mathematics Test | |||
| 2010 | 27.0% | 9.0% | 68.0% |
| 2009 | 50.0% | - | 66.0% |
| 2008 | 30.0% | 7.0% | 61.0% |
Grade 5 - % of students at or above proficiency
| School | District | State | |
|---|---|---|---|
| CST English-Language Arts Test | |||
| 2010 | 44.0% | - | 58.0% |
| 2009 | 57.0% | - | 54.0% |
| 2008 | 14.0% | 20.0% | 48.0% |
| CST Mathematics Test | |||
| 2010 | 30.0% | - | 61.0% |
| 2009 | 37.0% | - | 57.0% |
| 2008 | 18.0% | - | 51.0% |
| CST Science Test | |||
| 2010 | 38.0% | - | 56.0% |
| 2009 | 45.0% | 10.0% | 49.0% |
| 2008 | 18.0% | 14.0% | 46.0% |
Grade 6 - % of students at or above proficiency
| School | District | State | |
|---|---|---|---|
| CST English-Language Arts Test | |||
| 2010 | 54.0% | 7.0% | 55.0% |
| 2009 | 40.0% | 6.0% | 52.0% |
| 2008 | 45.0% | - | 47.0% |
| CST Mathematics Test | |||
| 2010 | 27.0% | - | 52.0% |
| 2009 | 21.0% | - | 49.0% |
| 2008 | 25.0% | - | 44.0% |
Grade 7 - % of students at or above proficiency
| School | District | State | |
|---|---|---|---|
| CST English-Language Arts Test | |||
| 2010 | 52.0% | 8.0% | 55.0% |
| 2009 | 46.0% | 7.0% | 54.0% |
| 2008 | 37.0% | 3.0% | 49.0% |
| CST Mathematics Test | |||
| 2010 | 35.0% | 2.0% | 48.0% |
| 2009 | 21.0% | 5.0% | 43.0% |
| 2008 | 35.0% | - | 41.0% |
Grade 8 - % of students at or above proficiency
| School | District | State | |
|---|---|---|---|
| CST Algebra I Test | |||
| 2010 | 10.0% | - | 46.0% |
| 2009 | 5.0% | - | 44.0% |
| 2008 | 14.0% | - | 42.0% |
| CST English-Language Arts Test | |||
| 2010 | 49.0% | 2.0% | 54.0% |
| 2009 | 31.0% | 4.0% | 48.0% |
| 2008 | 32.0% | 7.0% | 45.0% |
| CST History - Social Science Test | |||
| 2010 | 32.0% | 1.0% | 47.0% |
| 2009 | 20.0% | 1.0% | 42.0% |
| 2008 | 17.0% | 2.0% | 36.0% |
| CST Science Test | |||
| 2010 | 28.0% | - | 59.0% |
| 2009 | 29.0% | 2.0% | 56.0% |
| 2008 | 25.0% | 2.0% | 52.0% |
Grade 9 - % of students at or above proficiency
| School | District | State | |
|---|---|---|---|
| CST Algebra I Test | |||
| 2010 | 10.0% | - | 22.0% |
| 2009 | 5.0% | 1.0% | 21.0% |
| 2008 | 4.0% | 3.0% | 18.0% |
| CST Biology Test | |||
| 2010 | 17.0% | - | 55.0% |
| 2009 | - | - | - |
| 2008 | 6.0% | - | 52.0% |
| CST Earth Science Test | |||
| 2010 | 20.0% | - | 35.0% |
| 2009 | 17.0% | - | 29.0% |
| 2008 | 11.0% | - | 31.0% |
| CST English-Language Arts Test | |||
| 2010 | 40.0% | 6.0% | 54.0% |
| 2009 | 38.0% | 8.0% | 50.0% |
| 2008 | 34.0% | 9.0% | 49.0% |
| CST World History Test | |||
| 2010 | 9.0% | - | 45.0% |
| 2009 | 15.0% | - | 41.0% |
| 2008 | 9.0% | - | 36.0% |
| CST Geometry Test | |||
| 2009 | 21.0% | - | 47.0% |
Grade 10 - % of students at or above proficiency
| School | District | State | |
|---|---|---|---|
| CST Algebra I Test | |||
| 2010 | 7.0% | 4.0% | 12.0% |
| 2009 | 5.0% | 2.0% | 11.0% |
| CST Algebra II Test | |||
| 2010 | 17.0% | - | 40.0% |
| CST Biology Test | |||
| 2010 | 21.0% | - | 38.0% |
| 2009 | 13.0% | - | 34.0% |
| 2008 | 20.0% | - | 35.0% |
| CST Earth Science Test | |||
| 2010 | 17.0% | - | 29.0% |
| 2009 | 17.0% | - | 23.0% |
| CST English-Language Arts Test | |||
| 2010 | 26.0% | 3.0% | 45.0% |
| 2009 | 25.0% | 4.0% | 44.0% |
| 2008 | 33.0% | 5.0% | 41.0% |
| CST Geometry Test | |||
| 2010 | 2.0% | - | 14.0% |
| 2009 | 6.0% | - | 14.0% |
| CST Science Test | |||
| 2010 | 19.0% | 5.0% | 46.0% |
| 2009 | 12.0% | 3.0% | 44.0% |
| 2008 | 19.0% | 4.0% | 40.0% |
| CST World History Test | |||
| 2010 | 16.0% | - | 42.0% |
| 2009 | 12.0% | - | 38.0% |
| 2008 | 11.0% | 4.0% | 33.0% |
Grade 11 - % of students at or above proficiency
| School | District | State | |
|---|---|---|---|
| CST Algebra II Test | |||
| 2010 | 13.0% | - | 14.0% |
| CST Biology Test | |||
| 2010 | 31.0% | - | 46.0% |
| 2009 | 8.0% | - | 41.0% |
| CST Earth Science Test | |||
| 2010 | 27.0% | - | 32.0% |
| 2009 | 16.0% | - | 26.0% |
| 2008 | 12.0% | - | 28.0% |
| CST English-Language Arts Test | |||
| 2010 | 24.0% | 4.0% | 42.0% |
| 2009 | 18.0% | 5.0% | 40.0% |
| 2008 | 18.0% | 8.0% | 37.0% |
| CST U.S. History Test | |||
| 2010 | 11.0% | 1.0% | 45.0% |
| 2009 | 16.0% | 6.0% | 44.0% |
| 2008 | 13.0% | 4.0% | 38.0% |
| CST World History Test | |||
| 2008 | 9.0% | 3.0% | 9.0% |
End of Course - % of students at or above proficiency
| School | District | State | |
|---|---|---|---|
| CST Algebra I Test | |||
| 2010 | 10.0% | 4.0% | 31.0% |
| 2009 | 5.0% | 1.0% | 28.0% |
| 2008 | 5.0% | 2.0% | 25.0% |
| CST Algebra II Test | |||
| 2010 | 14.0% | - | 31.0% |
| CST Biology Test | |||
| 2010 | 24.0% | - | 46.0% |
| 2009 | 9.0% | - | 42.0% |
| 2008 | 13.0% | - | 42.0% |
| CST Earth Science Test | |||
| 2010 | 20.0% | - | 33.0% |
| 2009 | 17.0% | - | 28.0% |
| 2008 | 14.0% | - | 28.0% |
| CST Geometry Test | |||
| 2010 | 2.0% | - | 27.0% |
| 2009 | 7.0% | - | 26.0% |
| CST World History Test | |||
| 2010 | 12.0% | 8.0% | 41.0% |
| 2009 | 13.0% | 2.0% | 38.0% |
| 2008 | 11.0% | 2.0% | 33.0% |
Source: CA Department of Education 2009-2010
School Map and Similar Schools Nearby
Click to Activate Map of Nearby School Campuses
Private
Public
This School
Similar Schools Nearby
| Career & Technical High School 9-12 | 123 Students | 0 miles away | Not Yet Rated | - |
| Dr. Lewis Dolphin Stallworth Sr. Charter School KG-12 | 116 Students | 3.9 miles away | Not Yet Rated | - |
| Stockton Alternative High School 9-12 | 163 Students | 4.7 miles away | Not Yet Rated | - |
| Stockton Unified Early College Academy 9-12 | 118 Students | 4.8 miles away | Not Yet Rated | - |
| Aspire Langston Hughes Academy 6-12 | 270 Students | 4.9 miles away | Not Yet Rated | - |
| Institute of Business, Management, and Law Charter School 9-12 | 321 Students | 8.5 miles away | Not Yet Rated | |
| Benjamin Holt College Preparatory Academy 6-12 | 578 Students | 9.2 miles away | ![]() 1 out of 5 | |
| Millennium Charter School 9-12 | 372 Students | 15.4 miles away | ![]() 3 out of 5 | |
Compare This School To Nearby Schools ->
School Community Forum

Join a discussion about Venture Academy and talk to others in the community including students, parents, teachers, and administrators.
Popular Discussion Topics
- Admissions and Registration Questions (e.g. Dress Code and Discipline Policy)
- School Calendar and Upcoming Events (e.g. Graduation)
- After School Programs, Extracurricular Activities, and Athletics (e.g. Football)
- News and Announcements (e.g. Yearbook and Class Supply List Details)
- Graduate and Alumni Events (e.g. Organizing Class Reunions)
Navigation
Can't Find What You Are Looking For?
Rankings
Nearby Cities
Sponsored Links
K-12 Articles
All About Backpacks
Your child riffles through his backpack to find homework assignments, his MP3 player, lunch money...
Promoting Childhood Literacy
The number of American adults who are illiterate is astounding. People who lack the ability to read...
Tips for Purchasing Back to School Supplies
In just a few days, kids from all over the US will be going back to school. Now is the time to take...


