County Community School
1290 Ridder Park Dr Mc213, San Jose, CA 95131 | (408) 453-6939
- Grades: KG-12
- Student Enrollment: 287
Rating
Not Available
Not Available

No Reviews Yet
Find Old Friends From County Community School
Use the form below to search for alumni from County Community School.
School Description
School Summary and Highlights
- Enrolls 287 elementary, middle, and high school students from grades KG-12
- 2010 Overall School AYP Met Status: No
Additional Contact Information
- Mailing Address: 1290 Ridder Park Dr., Mc213, San Jose, CA 95131
School Operational Details
- Alternative School
- Title I EligibleAll students of this school are eligible for participation in authorized programs.
School District Details
- Santa Clara County Office of Education School District
- Per-Pupil Spending: $48,424
- Graduation Rate: 26.8%
- Dropout Rate: 31.9%
- Students Per Teacher: 13.6
- Enrolled Students: 4,421
Faculty Details and Student Enrollment
Students and Faculty
- Total Students Enrolled: 287
- Total Full Time "Equivalent" Teachers: 31.0
- Average Student-To-Teacher Ratio: 9.3
Students Gender Breakdown
- Males: 214 (74.6%)
- Females: 73 (25.4%)
Free Lunch Student Eligibility Breakdown
- Eligible for Reduced Lunch: 42 (14.6%)
- Eligible for Free Lunch: 169 (58.9%)
- Eligible for Either Reduced or Free Lunch: 211 (73.5%)
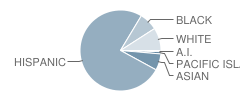
Student Enrollment Distribution by Race / Ethnicity
| Number | Percent | |
|---|---|---|
| American Indian | 2 | 0.7% |
| Black | 21 | 7.3% |
| Asian | 19 | 6.6% |
| Hispanic | 212 | 73.9% |
| White | 26 | 9.1% |
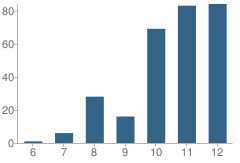
Number of Students Per Grade
| Number | Percent | |
|---|---|---|
| 6th Grade | 1 | 0.3% |
| 7th Grade | 6 | 2.1% |
| 8th Grade | 28 | 9.8% |
| 9th Grade | 16 | 5.6% |
| 10th Grade | 69 | 24.0% |
| 11th Grade | 83 | 28.9% |
| 12th Grade | 84 | 29.3% |
Graduates Information (2010)
Graduation Rate
School:
81.5%
District:
81.5%
State:
78.6%
Teacher Education Background (2009)
Percent With Master's Degree
School:
14.3%
District:
27.8%
Percent With Bachelor's Degree
School:
7.1%
District:
2.8%
Teacher Credentials & Experience (2009)
Percent of Teachers With Credentials: 83.3%
Number of Certificated Staff: 14.0
Average Number of Years of Teacher Experience: 16.4
Average Age
School:
47.6
District:
50.1
Source: CA Department of Education, Source: NCES 2009-2010
School Ratings and Reviews
Be The First To Review County Community School!
School Map and Similar Schools Nearby
Click to Activate Map of Nearby School Campuses
Private
Public
This School
Similar Schools Nearby
| Santa Clara County Juvenile Hall School KG-12 | 272 Students | 0 miles away | Not Yet Rated | |
| Pegasus High School 9-12 | 107 Students | 2.5 miles away | Not Yet Rated | |
| San Jose Community High School 9-12 | 33 Students | 2.8 miles away | Not Yet Rated | |
| San Jose High Academy Plus 9-12 | 40 Students | 2.8 miles away | Not Yet Rated | |
| Foothill High School 9-12 | 363 Students | 3.6 miles away | Not Yet Rated | |
| Milpitas Community Day School 8-12 | 20 Students | 3.7 miles away | Not Yet Rated | - |
| Wilson Alternative School KG-12 | 327 Students | 4.0 miles away | Not Yet Rated | |
| Lincoln Plus High School 10-12 | 40 Students | 4.3 miles away | Not Yet Rated | |
| Community Career Academy (Continuation) 9-12 | 12 Students | 4.4 miles away | Not Yet Rated | - |
| New Valley Continuation High School 9-12 | 173 Students | 5.6 miles away | Not Yet Rated | |
Compare This School To Nearby Schools ->
School Community Forum

Join a discussion about County Community School and talk to others in the community including students, parents, teachers, and administrators.
Popular Discussion Topics
- Admissions and Registration Questions (e.g. Dress Code and Discipline Policy)
- School Calendar and Upcoming Events (e.g. Graduation)
- After School Programs, Extracurricular Activities, and Athletics (e.g. Football)
- News and Announcements (e.g. Yearbook and Class Supply List Details)
- Graduate and Alumni Events (e.g. Organizing Class Reunions)
Navigation
Can't Find What You Are Looking For?
Rankings
Nearby Cities
Sponsored Links
K-12 Articles

Keep Your Licensed Teen Safe This Summer
Every year hundreds of teenage drivers lose their lives in motor vehicle accidents. Statistics show...
Every year hundreds of teenage drivers lose their lives in motor vehicle accidents. Statistics show...

Cutting Class
Depression is a very real problem for today's youth. When your spirit doesn't feel good, a lot of...
Depression is a very real problem for today's youth. When your spirit doesn't feel good, a lot of...

Keep Kids Learning All Summer
Early in the 20th century schools in urban districts operated all year `round. However, in rural...
Early in the 20th century schools in urban districts operated all year `round. However, in rural...