Santa Clara County Special Education School
1290 Ridder Park Dr Mc271, San Jose, CA 95131 | (408) 453-6895
- Grades: KG-12
- Student Enrollment: 1,179
Rating
Not Available
Not Available

No Reviews Yet
Find Old Friends From Santa Clara County Special Education School
Use the form below to search for alumni from Santa Clara County Special Education School.
School Description
School Summary and Highlights
- Enrolls 1,179 elementary, middle, and high school students from grades KG-12
- 2010 Overall School AYP Met Status: No
Additional Contact Information
- Mailing Address: 1290 Ridder Park Dr., Mc271, San Jose, CA 95131
School Operational Details
- Special Education School
- Title I EligibleAll students of this school are eligible for participation in authorized programs.
School District Details
- Santa Clara County Office of Education School District
- Per-Pupil Spending: $48,424
- Graduation Rate: 26.8%
- Dropout Rate: 31.9%
- Students Per Teacher: 13.6
- Enrolled Students: 4,421
Faculty Details and Student Enrollment
Students and Faculty
- Total Students Enrolled: 1,179
- Total Full Time "Equivalent" Teachers: 155.0
- Average Student-To-Teacher Ratio: 7.6
Students Gender Breakdown
- Males: 736 (62.4%)
- Females: 443 (37.6%)
Free Lunch Student Eligibility Breakdown
- Eligible for Reduced Lunch: 85 (7.2%)
- Eligible for Free Lunch: 542 (46.0%)
- Eligible for Either Reduced or Free Lunch: 627 (53.2%)
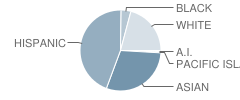
Student Enrollment Distribution by Race / Ethnicity
| Number | Percent | |
|---|---|---|
| American Indian | 7 | 0.6% |
| Black | 47 | 4.0% |
| Asian | 343 | 29.1% |
| Hispanic | 513 | 43.5% |
| White | 241 | 20.4% |
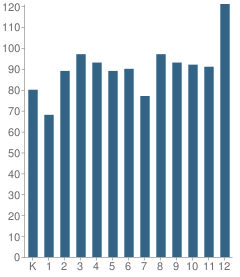
Number of Students Per Grade
| Number | Percent | |
|---|---|---|
| Kindergarten | 80 | 6.8% |
| 1st Grade | 68 | 5.8% |
| 2nd Grade | 89 | 7.5% |
| 3rd Grade | 97 | 8.2% |
| 4th Grade | 93 | 7.9% |
| 5th Grade | 89 | 7.5% |
| 6th Grade | 90 | 7.6% |
| 7th Grade | 77 | 6.5% |
| 8th Grade | 97 | 8.2% |
| 9th Grade | 93 | 7.9% |
| 10th Grade | 92 | 7.8% |
| 11th Grade | 91 | 7.7% |
| 12th Grade | 121 | 10.3% |
| Ungraded | 2 | 0.2% |
Graduates Information (2010)
Graduation Rate
School:
81.5%
District:
81.5%
State:
78.6%
Teacher Education Background (2009)
Percent With Ph.D.
School:
3.9%
District:
16.7%
Percent With Master's Degree
School:
25.2%
District:
27.8%
Percent With Bachelor's Degree
School:
13.8%
District:
2.8%
Teacher Credentials & Experience (2009)
Percent of Teachers With Emergency Credentials: 10.5%
Percent of Teachers With Credentials: 75.9%
Number of Certificated Staff: 254.0
Average Number of Years of Teacher Experience: 15.9
Average Age
School:
48.0
District:
50.1
Source: CA Department of Education, Source: NCES 2009-2010
School Ratings and Reviews
Be The First To Review Santa Clara County Special Education School!
School Community Forum

Join a discussion about Santa Clara County Special Education School and talk to others in the community including students, parents, teachers, and administrators.
Popular Discussion Topics
- Admissions and Registration Questions (e.g. Dress Code and Discipline Policy)
- School Calendar and Upcoming Events (e.g. Graduation)
- After School Programs, Extracurricular Activities, and Athletics (e.g. Football)
- News and Announcements (e.g. Yearbook and Class Supply List Details)
- Graduate and Alumni Events (e.g. Organizing Class Reunions)
Navigation
Can't Find What You Are Looking For?
Rankings
Nearby Cities
Sponsored Links
K-12 Articles

Teaching Your Kids About Respect, Values and Violence
These days it seems that every newscast reports at least once incident of violence. As parents, we...
These days it seems that every newscast reports at least once incident of violence. As parents, we...

Everyone Loves Going to the Doctor and Dentist
Going to the doctor or dentist can be traumatic for children of all ages. Many adults do not...
Going to the doctor or dentist can be traumatic for children of all ages. Many adults do not...

Teaching Children Respect
Statistics prove that there are many different family types in today's society. Grandparents or a...
Statistics prove that there are many different family types in today's society. Grandparents or a...