Eastern Pau School
Rating
Not Available
Not Available

No Reviews Yet
Find Old Friends From Eastern Pau School
Use the form below to search for alumni from Eastern Pau School.
School Description
School Summary and Highlights
- Enrolls 194 middle and high school students from grades 6-12
- 2010 Overall School AYP Met Status: No
Additional Contact Information
- Mailing Address: 5777 South Lockheed Ave., Whittier, CA 90606
School Operational Details
- Alternative School
- Title I EligibleAll students of this school are eligible for participation in authorized programs.
School District Details
- Los Angeles County Office of Education School District
- Per-Pupil Spending: $61,034
- Graduation Rate: 57.4%
- Dropout Rate: 37.2%
- Students Per Teacher: 10.0
- Enrolled Students: 8,575
Faculty Details and Student Enrollment
Students and Faculty
- Total Students Enrolled: 194
- Total Full Time "Equivalent" Teachers: 23.0
- Average Student-To-Teacher Ratio: 8.4
Students Gender Breakdown
- Males: 146 (75.3%)
- Females: 48 (24.7%)
Free Lunch Student Eligibility Breakdown
- Eligible for Reduced Lunch: 22 (11.3%)
- Eligible for Free Lunch: 97 (50.0%)
- Eligible for Either Reduced or Free Lunch: 119 (61.3%)
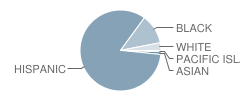
Student Enrollment Distribution by Race / Ethnicity
| Number | Percent | |
|---|---|---|
| American Indian | - | - |
| Black | 23 | 11.9% |
| Asian | 2 | 1.0% |
| Hispanic | 162 | 83.5% |
| White | 6 | 3.1% |
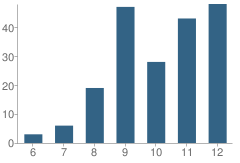
Number of Students Per Grade
| Number | Percent | |
|---|---|---|
| 6th Grade | 3 | 1.5% |
| 7th Grade | 6 | 3.1% |
| 8th Grade | 19 | 9.8% |
| 9th Grade | 47 | 24.2% |
| 10th Grade | 28 | 14.4% |
| 11th Grade | 43 | 22.2% |
| 12th Grade | 48 | 24.7% |
Graduates Information (2010)
Graduation Rate
School:
75.7%
District:
75.7%
State:
78.6%
Teacher Education Background (2009)
Percent With Ph.D.
School:
11.1%
District:
18.0%
Percent With Master's Degree
School:
11.1%
District:
25.8%
Teacher Credentials & Experience (2009)
Percent of Teachers With Emergency Credentials: 8.3%
Percent of Teachers With Credentials: 100.0%
Number of Certificated Staff: 18.0
Average Number of Years of Teacher Experience: 17.7
Average Age
School:
52.4
District:
50.9
Source: CA Department of Education, Source: NCES 2009-2010
School Ratings and Reviews
Be The First To Review Eastern Pau School!
School Map and Similar Schools Nearby
Click to Activate Map of Nearby School Campuses
Private
Public
This School
Similar Schools Nearby
| Ruben Salazar Continuation School 9-12 | 231 Students | 1.6 miles away | Not Yet Rated | |
| Montebello Community Day School 7-12 | 166 Students | 2.7 miles away | Not Yet Rated | |
| Frontier High (Continuation) School 9-12 | 783 Students | 3.2 miles away | Not Yet Rated | |
| Vail High (Continuation) School 9-12 | 395 Students | 3.7 miles away | Not Yet Rated | |
| El Camino High (Continuation) School 9-12 | 328 Students | 5.8 miles away | Not Yet Rated | |
| Monterey Continuation School 9-12 | 63 Students | 5.9 miles away | Not Yet Rated | |
| Columbus Continuation School 9-12 | 356 Students | 6.0 miles away | Not Yet Rated | |
| Los Angeles County Alternative / Opportunity School KG-12 | 604 Students | 6.6 miles away | Not Yet Rated | |
| L.a. County High School for the Arts 9-12 | 716 Students | 7.7 miles away | Not Yet Rated | |
| Ramona Opportunity High School 7-12 | 131 Students | 7.9 miles away |  4 out of 5 | |
Compare This School To Nearby Schools ->
School Community Forum

Join a discussion about Eastern Pau School and talk to others in the community including students, parents, teachers, and administrators.
Popular Discussion Topics
- Admissions and Registration Questions (e.g. Dress Code and Discipline Policy)
- School Calendar and Upcoming Events (e.g. Graduation)
- After School Programs, Extracurricular Activities, and Athletics (e.g. Football)
- News and Announcements (e.g. Yearbook and Class Supply List Details)
- Graduate and Alumni Events (e.g. Organizing Class Reunions)
Navigation
Can't Find What You Are Looking For?
Rankings
Nearby Cities
Sponsored Links
K-12 Articles

Teaching Children a Love of History
Parents and grandparents are responsible for teaching children a love of history. To begin, relate...
Parents and grandparents are responsible for teaching children a love of history. To begin, relate...

School's out for Recess
Recess used to be the best part of school; that and lunch. But today, a shocking two-thirds of...
Recess used to be the best part of school; that and lunch. But today, a shocking two-thirds of...

School Violence: Can It Be Stopped
It's a fact that violence in schools is prevalent in today's society. We hear of school shootings,...
It's a fact that violence in schools is prevalent in today's society. We hear of school shootings,...