Expeditionary Learning School

No Reviews Yet
Find Old Friends From Expeditionary Learning School
Use the form below to search for alumni from Expeditionary Learning School.
School Description
School Summary and Highlights
- Enrolls 351 elementary, middle, and high school students from grades KG-12
- Ranks 143rd out of 282 high schools in CO.
Additional Contact Information
- Mailing Address: 1700 South Holly Street, Denver, CO 80222
Faculty Details and Student Enrollment
Students and Faculty
- Total Students Enrolled: 351
- Total Full Time "Equivalent" Teachers: 22.8
- Average Student-To-Teacher Ratio: 15.4
Students Gender Breakdown
- Males: 184 (52.4%)
- Females: 167 (47.6%)
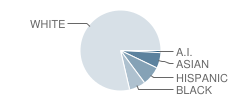
Student Enrollment Distribution by Race / Ethnicity

| Number | Percent | |
|---|---|---|
| American Indian | 3 | 0.9% |
| Black | 23 | 6.6% |
| Asian | 22 | 6.3% |
| Hispanic | 27 | 7.7% |
| White | 276 | 78.6% |
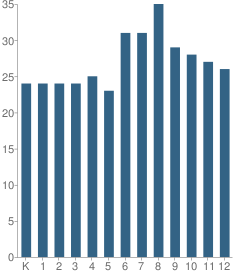
Number of Students Per Grade

| Number | Percent | |
|---|---|---|
| Kindergarten | 24 | 6.8% |
| 1st Grade | 24 | 6.8% |
| 2nd Grade | 24 | 6.8% |
| 3rd Grade | 24 | 6.8% |
| 4th Grade | 25 | 7.1% |
| 5th Grade | 23 | 6.6% |
| 6th Grade | 31 | 8.8% |
| 7th Grade | 31 | 8.8% |
| 8th Grade | 35 | 10.0% |
| 9th Grade | 29 | 8.3% |
| 10th Grade | 28 | 8.0% |
| 11th Grade | 27 | 7.7% |
| 12th Grade | 26 | 7.4% |
Faculty Educational Background (2006-07)
- Teachers with a Bachelor's Degree: -
- Teachers with a Master's Degree or Higher:90%
Faculty Salary and Experience (2006-2007)
- Average Teaching Experience: 14 Years
- Average Salary: $44,687
Teacher Experience by Number of Years

| Salary | Percent | |
|---|---|---|
| 1-5 Years of Teaching Experience | - | - |
| More Than 5 Years of Teaching Experience | $45,337 | 95% |
Source: CO Department of Education, Source: NCES 2009-2010
School Ratings and Reviews
Be The First To Review Expeditionary Learning School!
Sponsored Links
Test Scores and Performance Information
Overall School Rating
How is this determined?
The overall school rating shows that Expeditionary Learning School performed on average better than many other schools across the state on CSAP state exams in the following subjects:
- Math
- Reading
- Science
- Writing
CSAP - Test Proficiency by Grade and Subject
Grade 3 - % of students at or above proficiency
| School | District | State | |
|---|---|---|---|
| Math Test | |||
| 2010 | 91.0% | 91.0% | 71.0% |
| 2009 | 92.0% | 92.0% | 69.0% |
| 2008 | 87.0% | 87.0% | 70.0% |
| Reading Test | |||
| 2010 | 91.0% | 91.0% | 70.0% |
| 2009 | 92.0% | 92.0% | 73.0% |
| 2008 | 91.0% | 91.0% | 71.0% |
| Writing Test | |||
| 2010 | 60.0% | 60.0% | 51.0% |
| 2009 | 84.0% | 84.0% | 53.0% |
| 2008 | 44.0% | 44.0% | 50.0% |
Grade 4 - % of students at or above proficiency
| School | District | State | |
|---|---|---|---|
| Math Test | |||
| 2010 | 80.0% | 80.0% | 70.0% |
| 2009 | 74.0% | 74.0% | 71.0% |
| 2008 | 51.0% | 51.0% | 68.0% |
| Reading Test | |||
| 2010 | 76.0% | 76.0% | 65.0% |
| 2009 | 74.0% | 74.0% | 65.0% |
| 2008 | 79.0% | 79.0% | 66.0% |
| Writing Test | |||
| 2010 | 60.0% | 60.0% | 51.0% |
| 2009 | 43.0% | 43.0% | 51.0% |
| 2008 | 50.0% | 50.0% | 52.0% |
Grade 5 - % of students at or above proficiency
| School | District | State | |
|---|---|---|---|
| Math Test | |||
| 2010 | 74.0% | 74.0% | 65.0% |
| 2009 | 68.0% | 68.0% | 63.0% |
| 2008 | 71.0% | 71.0% | 65.0% |
| Reading Test | |||
| 2010 | 83.0% | 83.0% | 70.0% |
| 2009 | 80.0% | 80.0% | 69.0% |
| 2008 | 96.0% | 96.0% | 70.0% |
| Science Test | |||
| 2010 | 47.0% | 47.0% | 47.0% |
| 2009 | 56.0% | 56.0% | 45.0% |
| 2008 | 54.0% | 54.0% | 44.0% |
| Writing Test | |||
| 2010 | 57.0% | 57.0% | 58.0% |
| 2009 | 52.0% | 52.0% | 58.0% |
| 2008 | 58.0% | 58.0% | 59.0% |
Grade 6 - % of students at or above proficiency
| School | District | State | |
|---|---|---|---|
| Math Test | |||
| 2010 | 55.0% | 55.0% | 62.0% |
| 2009 | 80.0% | 80.0% | 63.0% |
| 2008 | 49.0% | 49.0% | 61.0% |
| Reading Test | |||
| 2010 | 77.0% | 77.0% | 72.0% |
| 2009 | 86.0% | 86.0% | 72.0% |
| 2008 | 83.0% | 83.0% | 71.0% |
| Writing Test | |||
| 2010 | 64.0% | 64.0% | 57.0% |
| 2009 | 77.0% | 77.0% | 60.0% |
| 2008 | 46.0% | 46.0% | 59.0% |
Grade 7 - % of students at or above proficiency
| School | District | State | |
|---|---|---|---|
| Math Test | |||
| 2010 | 48.0% | 48.0% | 49.0% |
| 2009 | 45.0% | 45.0% | 55.0% |
| 2008 | 29.0% | 29.0% | 46.0% |
| Reading Test | |||
| 2010 | 90.0% | 90.0% | 68.0% |
| 2009 | 76.0% | 76.0% | 68.0% |
| 2008 | 81.0% | 81.0% | 65.0% |
| Writing Test | |||
| 2010 | 74.0% | 74.0% | 58.0% |
| 2009 | 61.0% | 61.0% | 61.0% |
| 2008 | 72.0% | 72.0% | 58.0% |
Grade 8 - % of students at or above proficiency
| School | District | State | |
|---|---|---|---|
| Math Test | |||
| 2010 | 56.0% | 56.0% | 51.0% |
| 2009 | 54.0% | 54.0% | 50.0% |
| 2008 | 33.0% | 33.0% | 47.0% |
| Reading Test | |||
| 2010 | 80.0% | 80.0% | 68.0% |
| 2009 | 88.0% | 88.0% | 64.0% |
| 2008 | 82.0% | 82.0% | 67.0% |
| Science Test | |||
| 2010 | 74.0% | 74.0% | 48.0% |
| 2009 | 70.0% | 70.0% | 49.0% |
| 2008 | 52.0% | 52.0% | 46.0% |
| Writing Test | |||
| 2010 | 61.0% | 61.0% | 55.0% |
| 2009 | 64.0% | 64.0% | 52.0% |
| 2008 | 60.0% | 60.0% | 52.0% |
Grade 9 - % of students at or above proficiency
| School | District | State | |
|---|---|---|---|
| Math Test | |||
| 2010 | 33.0% | 33.0% | 39.0% |
| 2009 | 17.0% | 17.0% | 35.0% |
| 2008 | 44.0% | 44.0% | 37.0% |
| Reading Test | |||
| 2010 | 85.0% | 85.0% | 67.0% |
| 2009 | 78.0% | 78.0% | 67.0% |
| 2008 | 93.0% | 93.0% | 66.0% |
| Writing Test | |||
| 2010 | 58.0% | 58.0% | 49.0% |
| 2009 | 65.0% | 65.0% | 52.0% |
| 2008 | 59.0% | 59.0% | 49.0% |
Grade 10 - % of students at or above proficiency
| School | District | State | |
|---|---|---|---|
| Math Test | |||
| 2010 | 15.0% | 15.0% | 30.0% |
| 2009 | 16.0% | 16.0% | 30.0% |
| 2008 | 15.0% | 15.0% | 30.0% |
| Reading Test | |||
| 2010 | 65.0% | 65.0% | 66.0% |
| 2009 | 88.0% | 88.0% | 70.0% |
| 2008 | 93.0% | 93.0% | 66.0% |
| Science Test | |||
| 2010 | 69.0% | 69.0% | 47.0% |
| 2009 | 80.0% | 80.0% | 50.0% |
| 2008 | 58.0% | 58.0% | 47.0% |
| Writing Test | |||
| 2010 | 32.0% | 32.0% | 47.0% |
| 2009 | 52.0% | 52.0% | 49.0% |
| 2008 | 54.0% | 54.0% | 47.0% |
Source: CO Department of Education 2009-2010
School Map and Similar Schools Nearby
Click to Activate Map of Nearby School Campuses
Private
Public
This School
Similar Schools Nearby
| George Washington High School 9-12 | 1,491 Students | 1.5 miles away | Not Yet Rated | |
| South High School 9-12 | 1,392 Students | 2.4 miles away | Not Yet Rated | |
| Thomas Jefferson High School 9-12 | 1,078 Students | 2.6 miles away | Not Yet Rated | |
| Overland High School 9-12 | 2,138 Students | 4.2 miles away | Not Yet Rated | |
| Cherry Creek High School 9-12 | 3,501 Students | 4.3 miles away | ![]() 5 out of 5 | |
| Denver School of the Arts 6-12 | 949 Students | 4.4 miles away | ![]() 5 out of 5 | |
| Online High School 9-12 | 128 Students | 4.6 miles away | Not Yet Rated | |
| Aurora Central High School 9-12 | 2,437 Students | 5.0 miles away | Not Yet Rated | |
| Manual High School 9-11 | 303 Students | 5.5 miles away | Not Yet Rated | |
| Gateway High School 9-12 | 1,728 Students | 5.5 miles away | Not Yet Rated | |
Compare This School To Nearby Schools ->
School Community Forum

Join a discussion about Expeditionary Learning School and talk to others in the community including students, parents, teachers, and administrators.
Popular Discussion Topics
- Admissions and Registration Questions (e.g. Dress Code and Discipline Policy)
- School Calendar and Upcoming Events (e.g. Graduation)
- After School Programs, Extracurricular Activities, and Athletics (e.g. Football)
- News and Announcements (e.g. Yearbook and Class Supply List Details)
- Graduate and Alumni Events (e.g. Organizing Class Reunions)
Navigation
Can't Find What You Are Looking For?
Rankings
Nearby Cities
Sponsored Links
K-12 Articles
Asperger Syndrome: A Developmental Disorder on the Autism Spectrum
Asperger Syndrome, also known as Pervasive Developmental Disorder is on the high functioning end of...
Those Pesky Little Transitions
Transitions are rarely easy, yet we have to encounter them every day of our lives. For school-aged...
Teaching Children with Learning Disabilities to Make Friends
Children with learning disabilities often have trouble making and retaining friendships. Some kids...

