Centennial Elementary School
Rating
Not Available
Not Available

No Reviews Yet
Find Old Friends From Centennial Elementary School
Use the form below to search for alumni from Centennial Elementary School.
School Description
School Summary and Highlights
- Enrolls 584 preschool and elementary school students from grades PK-8
- Ranks 353rd out of 408 middle schools in CO.
Additional Contact Information
- Mailing Address: 4665 Raleigh Street, Denver, CO 80212
School Operational Details
- Title I EligibleAll students of this school are eligible for participation in authorized programs.
School District Details
- Denver Public Schools District
- Per-Pupil Spending: $15,769
- Graduation Rate: 50.4%
- Dropout Rate: 13.8%
- Students Per Teacher: 17.0
- Enrolled Students: 77,267
Faculty Details and Student Enrollment
Students and Faculty
- Total Students Enrolled: 584
- Total Full Time "Equivalent" Teachers: 37.8
- Average Student-To-Teacher Ratio: 15.4
Students Gender Breakdown
- Males: 309 (52.9%)
- Females: 275 (47.1%)
Free Lunch Student Eligibility Breakdown
- Eligible for Reduced Lunch: 71 (12.2%)
- Eligible for Free Lunch: 389 (66.6%)
- Eligible for Either Reduced or Free Lunch: 460 (78.8%)
Student Enrollment Distribution by Race / Ethnicity
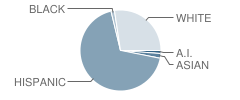
| Number | Percent | |
|---|---|---|
| American Indian | 7 | 1.2% |
| Black | 8 | 1.4% |
| Asian | 11 | 1.9% |
| Hispanic | 398 | 68.2% |
| White | 160 | 27.4% |
Number of Students Per Grade
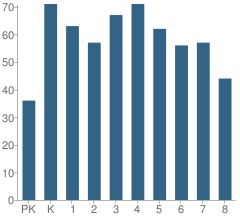
| Number | Percent | |
|---|---|---|
| Pre-Kindergarten | 36 | 6.2% |
| Kindergarten | 71 | 12.2% |
| 1st Grade | 63 | 10.8% |
| 2nd Grade | 57 | 9.8% |
| 3rd Grade | 67 | 11.5% |
| 4th Grade | 71 | 12.2% |
| 5th Grade | 62 | 10.6% |
| 6th Grade | 56 | 9.6% |
| 7th Grade | 57 | 9.8% |
| 8th Grade | 44 | 7.5% |
Faculty Educational Background (2006-07)
- Teachers with a Bachelor's Degree: 59%
- Teachers with a Master's Degree or Higher:41%
Faculty Salary and Experience (2006-2007)
- Average Teaching Experience: 12 Years
- Average Salary: $43,682
Teacher Experience by Number of Years
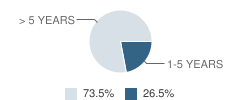
| Salary | Percent | |
|---|---|---|
| 1-5 Years of Teaching Experience | $32,325 | 27% |
| More Than 5 Years of Teaching Experience | $47,771 | 74% |
Source: CO Department of Education, Source: NCES 2009-2010
School Ratings and Reviews
Be The First To Review Centennial Elementary School!
School Map and Similar Schools Nearby
Click to Activate Map of Nearby School Campuses
Private
Public
This School
Similar Schools Nearby
| Edison Elementary School PK-5 | 566 Students | 1.1 miles away |  5 out of 5 | |
| Columbian Elementary School PK-5 | 319 Students | 1.2 miles away | Not Yet Rated | |
| Beach Court Elementary School PK-5 | 314 Students | 1.4 miles away | Not Yet Rated | |
| Martensen Elementary School PK-6 | 238 Students | 1.5 miles away | Not Yet Rated | |
| Academia Ana Marie Sandoval School PK-6 | 386 Students | 1.8 miles away | Not Yet Rated | |
| Stevens Elementary School KG-6 | 386 Students | 1.8 miles away | Not Yet Rated | |
| Brown Elementary School PK-5 | 461 Students | 1.9 miles away | Not Yet Rated | |
| Foster Elementary School PK-6 | 469 Students | 2.0 miles away | Not Yet Rated | |
| Valdez Elementary School PK-7 | 389 Students | 2.0 miles away | Not Yet Rated | |
| Bryant Webster Elementary School PK-8 | 456 Students | 2.0 miles away | Not Yet Rated | |
Compare This School To Nearby Schools ->
School Community Forum

Join a discussion about Centennial Elementary School and talk to others in the community including students, parents, teachers, and administrators.
Popular Discussion Topics
- Admissions and Registration Questions (e.g. Dress Code and Discipline Policy)
- School Calendar and Upcoming Events (e.g. Graduation)
- After School Programs, Extracurricular Activities, and Athletics (e.g. Football)
- News and Announcements (e.g. Yearbook and Class Supply List Details)
- Graduate and Alumni Events (e.g. Organizing Class Reunions)
Navigation
Can't Find What You Are Looking For?
Rankings
Sponsored Links
K-12 Articles

Breakfast, Kids and Learning
For generations parents have been telling their kids that breakfast is the most important meal of...
For generations parents have been telling their kids that breakfast is the most important meal of...

Parent and Family Involvement in School
When visiting my grandson's school, I often hear administrators and teachers complaining that not...
When visiting my grandson's school, I often hear administrators and teachers complaining that not...

Asperger Syndrome: A Developmental Disorder on the Autism Spectrum
Asperger Syndrome, also known as Pervasive Developmental Disorder is on the high functioning end of...
Asperger Syndrome, also known as Pervasive Developmental Disorder is on the high functioning end of...