William S. Talbot Elementary School
Rating
Not Available
Not Available

No Reviews Yet
Find Old Friends From William S. Talbot Elementary School
Use the form below to search for alumni from William S. Talbot Elementary School.
School Description
School Summary and Highlights
- Enrolls 731 preschool and elementary school students from grades PK-5
- Ranks 88th out of 1,901 elementary schools in FL.
- National Blue Ribbon Schools Award 2006

School District Details
- Alachua County School District
- Per-Pupil Spending: $8,966
- Graduation Rate: 68.1%
- Dropout Rate: 4.4%
- Students Per Teacher: 15.8
- Enrolled Students: 27,783
Faculty Details and Student Enrollment
Students and Faculty
- Total Students Enrolled: 731
- Total Full Time "Equivalent" Teachers: 50.0
- Average Student-To-Teacher Ratio: 14.6
Students Gender Breakdown
- Males: 357 (48.8%)
- Females: 328 (44.9%)
Free Lunch Student Eligibility Breakdown
- Eligible for Reduced Lunch: 54 (7.4%)
- Eligible for Free Lunch: 110 (15.0%)
- Eligible for Either Reduced or Free Lunch: 164 (22.4%)
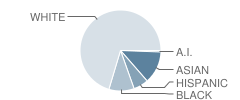
Student Enrollment Distribution by Race / Ethnicity
| Number | Percent | |
|---|---|---|
| American Indian | 4 | 0.5% |
| Black | 69 | 9.4% |
| Asian | 89 | 12.2% |
| Hispanic | 41 | 5.6% |
| White | 482 | 65.9% |
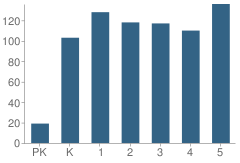
Number of Students Per Grade
| Number | Percent | |
|---|---|---|
| Pre-Kindergarten | 19 | 2.6% |
| Kindergarten | 103 | 14.1% |
| 1st Grade | 128 | 17.5% |
| 2nd Grade | 118 | 16.1% |
| 3rd Grade | 117 | 16.0% |
| 4th Grade | 110 | 15.0% |
| 5th Grade | 136 | 18.6% |
Teacher Educational Background (2010)
Percent of Teachers with a Bachelor's Degree
School:
36.0%
District:
48.2%
State:
65.3%
Percent of Teachers with a Ph.D.
School:
4.0%
District:
2.0%
State:
1.0%
Source: FL Department of Education, Source: NCES 2009-2010
School Ratings and Reviews
Be The First To Review William S. Talbot Elementary School!
School Map and Similar Schools Nearby
Click to Activate Map of Nearby School Campuses
Private
Public
This School
Similar Schools Nearby
| Glen Springs Elementary School PK-5 | 463 Students | 2.2 miles away | Not Yet Rated | |
| C. W. Norton Elementary School PK-5 | 657 Students | 2.3 miles away | Not Yet Rated | |
| Littlewood Elementary School PK-5 | 628 Students | 3.3 miles away | Not Yet Rated | |
| Stephen Foster Elementary School KG-5 | 466 Students | 3.6 miles away | Not Yet Rated | |
| Myra Terwilliger Elementary School PK-5 | 711 Students | 3.8 miles away |  5 out of 5 | |
| Hidden Oak Elementary School PK-5 | 836 Students | 3.9 miles away | Not Yet Rated | |
| J. J. Finley Elementary School KG-5 | 439 Students | 4.3 miles away | Not Yet Rated | |
| Marjorie Kinnan Rawlings Elementary School PK-5 | 395 Students | 4.9 miles away | Not Yet Rated | |
| W. A. Metcalfe Elementary School PK-5 | 531 Students | 5.5 miles away | 5 out of 5 | |
| P.k. Yonge Developmental Research School KG-12 | 1,139 Students | 5.5 miles away | Not Yet Rated | |
Compare This School To Nearby Schools ->
School Community Forum

Join a discussion about William S. Talbot Elementary School and talk to others in the community including students, parents, teachers, and administrators.
Popular Discussion Topics
- Admissions and Registration Questions (e.g. Dress Code and Discipline Policy)
- School Calendar and Upcoming Events (e.g. Graduation)
- After School Programs, Extracurricular Activities, and Athletics (e.g. Football)
- News and Announcements (e.g. Yearbook and Class Supply List Details)
- Graduate and Alumni Events (e.g. Organizing Class Reunions)
Navigation
Can't Find What You Are Looking For?
Nearby Cities
Sponsored Links
K-12 Articles

Keep Morning Stress at a Minimum: Establish a Routine
Morning! It can be a time of stress. The kids are fighting over who gets to use the bathroom first,...
Morning! It can be a time of stress. The kids are fighting over who gets to use the bathroom first,...

The First Day of School
The first day of kindergarten is a rite of passage for any student. Every mother cries and...
The first day of kindergarten is a rite of passage for any student. Every mother cries and...

Preparing Your Child for the First Day of School
It seems like school was just dismissed for the summer, yet here we are facing another year of back...
It seems like school was just dismissed for the summer, yet here we are facing another year of back...