Norcrest Elementary School
Rating
Not Available
Not Available

5 out of 5 | 1 Review
Find Old Friends From Norcrest Elementary School
Use the form below to search for alumni from Norcrest Elementary School.
School Description
School Summary and Highlights
- Enrolls 777 preschool and elementary school students from grades PK-5
- Ranks 691st out of 1,901 elementary schools in FL.
School Operational Details
- Title I EligibleAll students of this school are eligible for participation in authorized programs.
School District Details
- Broward County School District
- Per-Pupil Spending: $9,037
- Graduation Rate: 67.2%
- Dropout Rate: 2.8%
- Students Per Teacher: 16.9
- Enrolled Students: 256,137
Faculty Details and Student Enrollment
Students and Faculty
- Total Students Enrolled: 777
- Total Full Time "Equivalent" Teachers: 53.0
- Average Student-To-Teacher Ratio: 14.7
Students Gender Breakdown
- Males: 390 (50.2%)
- Females: 371 (47.7%)
Free Lunch Student Eligibility Breakdown
- Eligible for Reduced Lunch: 47 (6.0%)
- Eligible for Free Lunch: 388 (49.9%)
- Eligible for Either Reduced or Free Lunch: 435 (56.0%)
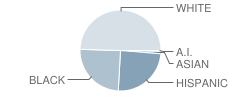
Student Enrollment Distribution by Race / Ethnicity
| Number | Percent | |
|---|---|---|
| American Indian | 3 | 0.4% |
| Black | 187 | 24.1% |
| Asian | 7 | 0.9% |
| Hispanic | 187 | 24.1% |
| White | 377 | 48.5% |
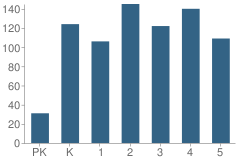
Number of Students Per Grade
| Number | Percent | |
|---|---|---|
| Pre-Kindergarten | 31 | 4.0% |
| Kindergarten | 124 | 16.0% |
| 1st Grade | 106 | 13.6% |
| 2nd Grade | 145 | 18.7% |
| 3rd Grade | 122 | 15.7% |
| 4th Grade | 140 | 18.0% |
| 5th Grade | 109 | 14.0% |
Teacher Educational Background (2010)
Percent of Teachers with a Bachelor's Degree
School:
58.8%
District:
59.6%
State:
65.3%
Percent of Classes Taught by Non-Highly Qualified Teachers
School:
4.2%
State:
4.8%
Percent of Classes Taught By Teachers (Out-of-Field) of Their Background
School:
4.0%
State:
4.8%
Source: FL Department of Education, Source: NCES 2009-2010
School Ratings and Reviews
Overall Rating: 5

5 out of 5 | 1 Review
The Overall Rating is the school's average rating from parents, students, school faculty and staff. The highest rating is five apples and the lowest is one apple.
Share Your Review About This School
1 review for Norcrest Elementary School
- Reviewed by Parent/Guardian on June 09, 2010
- Rating:
 (5 / 5) Flag as inappropriate
 - school is great the school should have more stuff that the kids could do there to make it fun for kids!!!!!!!!!!!!!!!!!!!!!!!!!!!!
School Map and Similar Schools Nearby
Click to Activate Map of Nearby School Campuses
Private
Public
This School
Similar Schools Nearby
| Park Ridge Elementary School PK-5 | 422 Students | 1.3 miles away | Not Yet Rated | |
| Cresthaven Elementary School PK-5 | 616 Students | 1.4 miles away |  5 out of 5 | |
| Tedder Elementary School PK-5 | 794 Students | 1.4 miles away | Not Yet Rated | |
| Palmview Elementary School PK-5 | 637 Students | 1.7 miles away | 5 out of 5 | |
| Deerfield Park Elementary School PK-5 | 664 Students | 2.1 miles away | Not Yet Rated | |
| Sanders Park Elementary School PK-5 | 524 Students | 2.8 miles away | Not Yet Rated | |
| Deerfield Beach Elementary School PK-5 | 791 Students | 2.8 miles away | 5 out of 5 | |
| Pompano Beach Elementary School PK-5 | 578 Students | 2.9 miles away | 5 out of 5 | |
| Robert C. Markham Elementary School PK-5 | 517 Students | 3.5 miles away |  4 out of 5 | |
| Cypress Elementary School PK-5 | 867 Students | 4.5 miles away |  3.5 out of 5 | |
Compare This School To Nearby Schools ->
School Community Forum

Join a discussion about Norcrest Elementary School and talk to others in the community including students, parents, teachers, and administrators.
Popular Discussion Topics
- Admissions and Registration Questions (e.g. Dress Code and Discipline Policy)
- School Calendar and Upcoming Events (e.g. Graduation)
- After School Programs, Extracurricular Activities, and Athletics (e.g. Football)
- News and Announcements (e.g. Yearbook and Class Supply List Details)
- Graduate and Alumni Events (e.g. Organizing Class Reunions)
Navigation
Can't Find What You Are Looking For?
Nearby Cities
Sponsored Links
K-12 Articles

Keep Your Licensed Teen Safe This Summer
Every year hundreds of teenage drivers lose their lives in motor vehicle accidents. Statistics show...
Every year hundreds of teenage drivers lose their lives in motor vehicle accidents. Statistics show...

Idle Hands
The worst affliction affecting our kids today is not teen pregnancy, drugs and alcohol, or...
The worst affliction affecting our kids today is not teen pregnancy, drugs and alcohol, or...

Nothing New Under the Sun
"I had to go through the same thing when I went to school." Every parent has uttered this phrase,...
"I had to go through the same thing when I went to school." Every parent has uttered this phrase,...