Richard L. Sanders School
Rating
Not Available
Not Available

No Reviews Yet
Find Old Friends From Richard L. Sanders School
Use the form below to search for alumni from Richard L. Sanders School.
School Description
School Summary and Highlights
- Enrolls 106 elementary, middle, and high school students from grades KG-12
Additional Contact Information
- Mailing Address: 5025 76th Ave, Pinellas Park, FL 33781
School Operational Details
- Special Education School
- Title I EligibleAll students of this school are eligible for participation in authorized programs.
School District Details
- Pinellas County School District
- Per-Pupil Spending: $8,959
- Graduation Rate: 62.4%
- Dropout Rate: 2.6%
- Students Per Teacher: 15.7
- Enrolled Students: 105,238
Faculty Details and Student Enrollment
Students and Faculty
- Total Students Enrolled: 106
- Total Full Time "Equivalent" Teachers: 26.0
- Average Student-To-Teacher Ratio: 4.1
Students Gender Breakdown
- Males: 84 (79.2%)
- Females: 15 (14.2%)
Free Lunch Student Eligibility Breakdown
- Eligible for Reduced Lunch: 9 (8.5%)
- Eligible for Free Lunch: 80 (75.5%)
- Eligible for Either Reduced or Free Lunch: 89 (84.0%)
Student Enrollment Distribution by Race / Ethnicity
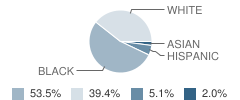
| Number | Percent | |
|---|---|---|
| American Indian | - | - |
| Black | 53 | 50.0% |
| Asian | 2 | 1.9% |
| Hispanic | 5 | 4.7% |
| White | 39 | 36.8% |
Number of Students Per Grade
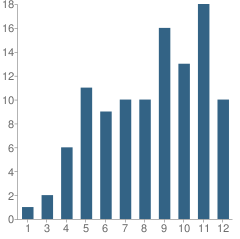
| Number | Percent | |
|---|---|---|
| 1st Grade | 1 | 0.9% |
| 3rd Grade | 2 | 1.9% |
| 4th Grade | 6 | 5.7% |
| 5th Grade | 11 | 10.4% |
| 6th Grade | 9 | 8.5% |
| 7th Grade | 10 | 9.4% |
| 8th Grade | 10 | 9.4% |
| 9th Grade | 16 | 15.1% |
| 10th Grade | 13 | 12.3% |
| 11th Grade | 18 | 17.0% |
| 12th Grade | 10 | 9.4% |
Graduation and Dropouts (2010)
Dropout Rate
School:
8.5%
District:
2.4%
State:
2.0%
Teacher Educational Background (2010)
Percent of Teachers with a Bachelor's Degree
School:
53.8%
District:
66.6%
State:
65.3%
Percent of Classes Taught by Non-Highly Qualified Teachers
School:
15.2%
State:
4.8%
Percent of Classes Taught By Teachers (Out-of-Field) of Their Background
School:
15.7%
State:
4.8%
Source: FL Department of Education, Source: NCES 2009-2010
School Ratings and Reviews
Be The First To Review Richard L. Sanders School!
School Map and Similar Schools Nearby
Click to Activate Map of Nearby School Campuses
Private
Public
This School
Similar Schools Nearby
| Nina Harris Ese Center School PK-12 | 230 Students | 1.1 miles away | Not Yet Rated | - |
| Hamilton Disston School KG-12 | 118 Students | 5.6 miles away | Not Yet Rated | |
| Extended Transition at Ptec Clearwater School 9-12 | 59 Students | 5.7 miles away | Not Yet Rated | - |
| Extended Transition at Abilities School 9-12 | 26 Students | 5.7 miles away | Not Yet Rated | - |
| Extended Transition at Creative Clay School 9-12 | 8 Students | 5.8 miles away | Not Yet Rated | - |
| Hospital / Homebound School PK-12 | 141 Students | 8.6 miles away | Not Yet Rated | |
Compare This School To Nearby Schools ->
School Community Forum

Join a discussion about Richard L. Sanders School and talk to others in the community including students, parents, teachers, and administrators.
Popular Discussion Topics
- Admissions and Registration Questions (e.g. Dress Code and Discipline Policy)
- School Calendar and Upcoming Events (e.g. Graduation)
- After School Programs, Extracurricular Activities, and Athletics (e.g. Football)
- News and Announcements (e.g. Yearbook and Class Supply List Details)
- Graduate and Alumni Events (e.g. Organizing Class Reunions)
Navigation
Can't Find What You Are Looking For?
Sponsored Links
K-12 Articles

Summer Advice
A few weeks ago, at the weekly after-school program I run through my local church, a group of...
A few weeks ago, at the weekly after-school program I run through my local church, a group of...

Educators and Childhood Obesity
Obesity in childhood is rising to epidemic proportions in America and educators should be...
Obesity in childhood is rising to epidemic proportions in America and educators should be...

Attend Your Teen's Holiday Parties
Christmas and New Years are coming, and with them Christmas and New Years Eve parties. At many of...
Christmas and New Years are coming, and with them Christmas and New Years Eve parties. At many of...