Salt River High School
Rating
Not Available
Not Available

No Reviews Yet
Find Old Friends From Salt River High School
Use the form below to search for alumni from Salt River High School.
School Description
School Summary and Highlights
- Enrolls 251 middle and high school students from grades 7-12
- Ranks 351st out of 385 high schools in AZ.
Additional Contact Information
- Mailing Address: 10,005 E. Osborn Rd., Scottsdale, AZ 85256
School Operational Details
- Title I EligibleAll students of this school are eligible for participation in authorized programs.
- Charter School
School District Details
- Salt River Pima-Maricopa Community Schools District
- Per-Pupil Spending: $17,036
- Graduation Rate: 100.0%
- Dropout Rate: 18.4%
- Enrolled Students: 293
Faculty Details and Student Enrollment
Students and Faculty
- Total Students Enrolled: 251
- Total Full Time "Equivalent" Teachers: 0
Students Gender Breakdown
- Males: 133 (53.0%)
- Females: 118 (47.0%)
Free Lunch Student Eligibility Breakdown
- Eligible for Reduced Lunch: 16 (6.4%)
- Eligible for Free Lunch: 75 (29.9%)
- Eligible for Either Reduced or Free Lunch: 91 (36.3%)
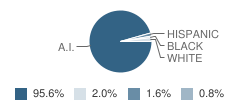
Student Enrollment Distribution by Race / Ethnicity
| Number | Percent | |
|---|---|---|
| American Indian | 240 | 95.6% |
| Black | 2 | 0.8% |
| Asian | - | - |
| Hispanic | 4 | 1.6% |
| White | 5 | 2.0% |
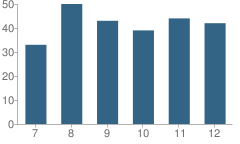
Number of Students Per Grade
| Number | Percent | |
|---|---|---|
| 7th Grade | 33 | 13.1% |
| 8th Grade | 50 | 19.9% |
| 9th Grade | 43 | 17.1% |
| 10th Grade | 39 | 15.5% |
| 11th Grade | 44 | 17.5% |
| 12th Grade | 42 | 16.7% |
Source: AZ Department of Education, Source: NCES 2009-2010
School Ratings and Reviews
Be The First To Review Salt River High School!
School Map and Similar Schools Nearby
Click to Activate Map of Nearby School Campuses
Private
Public
This School
Similar Schools Nearby
| Salt River Accelerated Learning Academy 9-12 | 42 Students | 3.2 miles away | Not Yet Rated | |
| Learning Foundation Performing Arts School KG-12 | 161 Students | 5.6 miles away |  5 out of 5 | |
| Shelby School, the KG-10 | 39 Students | 5.9 miles away | Not Yet Rated | - |
| Montessori Education Centre-Charter School North KG-9 | 180 Students | 6.1 miles away | Not Yet Rated | |
| Pinnacle High School - Mesa 9-12 | 84 Students | 6.1 miles away | Not Yet Rated | |
| Academy with Community Partners 9-12 | 144 Students | 6.3 miles away | Not Yet Rated | |
| Student Choice High School 9-12 | 123 Students | 6.4 miles away | 5 out of 5 | |
| Heritage Academy 7-12 | 519 Students | 6.4 miles away | 5 out of 5 | |
| Basis Scottsdale School 5-12 | 597 Students | 6.5 miles away | Not Yet Rated | |
| Sequoia Choice - Star Performing Arts School KG-12 | 76 Students | 6.6 miles away | Not Yet Rated | |
Compare This School To Nearby Schools ->
School Community Forum

Join a discussion about Salt River High School and talk to others in the community including students, parents, teachers, and administrators.
Popular Discussion Topics
- Admissions and Registration Questions (e.g. Dress Code and Discipline Policy)
- School Calendar and Upcoming Events (e.g. Graduation)
- After School Programs, Extracurricular Activities, and Athletics (e.g. Football)
- News and Announcements (e.g. Yearbook and Class Supply List Details)
- Graduate and Alumni Events (e.g. Organizing Class Reunions)
Navigation
Can't Find What You Are Looking For?
Nearby Cities
Sponsored Links
K-12 Articles

Who is Safe?
Between September 26 and October 2, 2006, there were three deadly school shootings and...
Between September 26 and October 2, 2006, there were three deadly school shootings and...

The Importance of Ninth Grade
Students who are entering ninth grade do not realize the importance of the critical decisions they...
Students who are entering ninth grade do not realize the importance of the critical decisions they...

How to Get the Best Supplies for Your Money
School supply lists can seem unending, and the price can add up very quickly. But do we really...
School supply lists can seem unending, and the price can add up very quickly. But do we really...