Anderson Elementary School
Rating
Not Available
Not Available

No Reviews Yet
Find Old Friends From Anderson Elementary School
Use the form below to search for alumni from Anderson Elementary School.
School Description
School Summary and Highlights
- Enrolls 484 preschool and elementary school students from grades PK-5
- Ranks 898th out of 1,322 elementary schools in GA.
School Operational Details
- Title I EligibleAll students of this school are eligible for participation in authorized programs.
School District Details
- Clayton County School District
- Per-Pupil Spending: $9,251
- Graduation Rate: 49.0%
- Dropout Rate: 2.0%
- Students Per Teacher: 14.4
- Enrolled Students: 50,204
Faculty Details and Student Enrollment
Students and Faculty
- Total Students Enrolled: 484
- Total Full Time "Equivalent" Teachers: 34.5
- Average Student-To-Teacher Ratio: 14.0
Students Gender Breakdown
- Males: 251 (51.9%)
- Females: 233 (48.1%)
Free Lunch Student Eligibility Breakdown
- Eligible for Reduced Lunch: 43 (8.9%)
- Eligible for Free Lunch: 344 (71.1%)
- Eligible for Either Reduced or Free Lunch: 387 (80.0%)
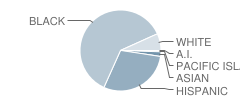
Student Enrollment Distribution by Race / Ethnicity
| Number | Percent | |
|---|---|---|
| American Indian | 2 | 0.4% |
| Black | 289 | 59.7% |
| Asian | 9 | 1.9% |
| Hispanic | 138 | 28.5% |
| White | 32 | 6.6% |
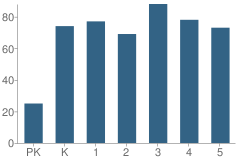
Number of Students Per Grade
| Number | Percent | |
|---|---|---|
| Pre-Kindergarten | 25 | 5.2% |
| Kindergarten | 74 | 15.3% |
| 1st Grade | 77 | 15.9% |
| 2nd Grade | 69 | 14.3% |
| 3rd Grade | 88 | 18.2% |
| 4th Grade | 78 | 16.1% |
| 5th Grade | 73 | 15.1% |
Source: GA Department of Education, Source: NCES 2009-2010
School Ratings and Reviews
Be The First To Review Anderson Elementary School!
School Map and Similar Schools Nearby
Click to Activate Map of Nearby School Campuses
Private
Public
This School
Similar Schools Nearby
| East Clayton Elementary School PK-5 | 650 Students | 2.6 miles away | Not Yet Rated | |
| Lake City Elementary School PK-5 | 501 Students | 2.6 miles away | Not Yet Rated | |
| Heritage Academy Elementary PK-5 | 473 Students | 2.9 miles away | Not Yet Rated | |
| Humphries Elementary School PK-5 | 362 Students | 3.2 miles away | Not Yet Rated | |
| Cedar Grove Elementary School PK-5 | 613 Students | 3.2 miles away |  1 out of 5 | |
| Thurgood Marshall Elementary School PK-5 | 817 Students | 3.5 miles away |  1.5 out of 5 | |
| Morrow Elementary School PK-5 | 490 Students | 3.7 miles away |  5 out of 5 | |
| Haynie Elementary School PK-5 | 724 Students | 4.0 miles away | Not Yet Rated | |
| Meadowview Elementary School PK-5 | 362 Students | 4.2 miles away | 5 out of 5 | |
| William M. Mcgarrah Elementary School PK-5 | 612 Students | 4.2 miles away | 5 out of 5 | |
Compare This School To Nearby Schools ->
School Community Forum

Join a discussion about Anderson Elementary School and talk to others in the community including students, parents, teachers, and administrators.
Popular Discussion Topics
- Admissions and Registration Questions (e.g. Dress Code and Discipline Policy)
- School Calendar and Upcoming Events (e.g. Graduation)
- After School Programs, Extracurricular Activities, and Athletics (e.g. Football)
- News and Announcements (e.g. Yearbook and Class Supply List Details)
- Graduate and Alumni Events (e.g. Organizing Class Reunions)
Navigation
Can't Find What You Are Looking For?
Nearby Cities
Sponsored Links
K-12 Articles

Idle Hands
The worst affliction affecting our kids today is not teen pregnancy, drugs and alcohol, or...
The worst affliction affecting our kids today is not teen pregnancy, drugs and alcohol, or...

Teaching Children a Love of History
Parents and grandparents are responsible for teaching children a love of history. To begin, relate...
Parents and grandparents are responsible for teaching children a love of history. To begin, relate...

Cut the Credit and Save You Some Money
Today's society glorifies a get-it-now mentality. Children learn this early. You probably noticed...
Today's society glorifies a get-it-now mentality. Children learn this early. You probably noticed...