Stevens Creek Elementary School
Rating
Not Available
Not Available

5 out of 5 | 2 Reviews
Find Old Friends From Stevens Creek Elementary School
Use the form below to search for alumni from Stevens Creek Elementary School.
School Description
School Summary and Highlights
- Enrolls 896 preschool and elementary school students from grades PK-5
- Ranks 58th out of 1,322 elementary schools in GA.
School District Details
- Columbia County School District
- Per-Pupil Spending: $8,585
- Graduation Rate: 76.7%
- Dropout Rate: 3.2%
- Students Per Teacher: 15.9
- Enrolled Students: 23,328
Faculty Details and Student Enrollment
Students and Faculty
- Total Students Enrolled: 896
- Total Full Time "Equivalent" Teachers: 52.7
- Average Student-To-Teacher Ratio: 17.0
Students Gender Breakdown
- Males: 444 (49.6%)
- Females: 452 (50.4%)
Free Lunch Student Eligibility Breakdown
- Eligible for Reduced Lunch: 35 (3.9%)
- Eligible for Free Lunch: 86 (9.6%)
- Eligible for Either Reduced or Free Lunch: 121 (13.5%)
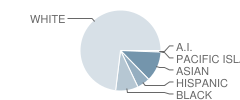
Student Enrollment Distribution by Race / Ethnicity
| Number | Percent | |
|---|---|---|
| American Indian | 5 | 0.6% |
| Black | 78 | 8.7% |
| Asian | 104 | 11.6% |
| Hispanic | 45 | 5.0% |
| White | 628 | 70.1% |
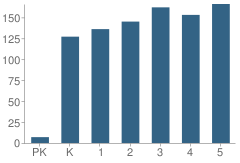
Number of Students Per Grade
| Number | Percent | |
|---|---|---|
| Pre-Kindergarten | 7 | 0.8% |
| Kindergarten | 127 | 14.2% |
| 1st Grade | 136 | 15.2% |
| 2nd Grade | 145 | 16.2% |
| 3rd Grade | 162 | 18.1% |
| 4th Grade | 153 | 17.1% |
| 5th Grade | 166 | 18.5% |
Source: GA Department of Education, Source: NCES 2009-2010
School Ratings and Reviews
Overall Rating: 5

5 out of 5 | 2 Reviews
The Overall Rating is the school's average rating from parents, students, school faculty and staff. The highest rating is five apples and the lowest is one apple.
Share Your Review About This School
2 reviews for Stevens Creek Elementary School
- Reviewed by Parent/Guardian on May 08, 2007
- Rating:
 (5 / 5) Flag as inappropriate
 - Great School, Teachers are super, keep kids active and challenge them. I am happy my kids go to this school
- Reviewed by Parent/Guardian on January 13, 2007
- Rating: (5 / 5) Flag as inappropriate
- The school is great, the teachers are even better. its the place you want your little one!
School Map and Similar Schools Nearby
Click to Activate Map of Nearby School Campuses
Private
Public
This School
Similar Schools Nearby
| New Elementary #5 School PK-5 | 791 Students | 2.1 miles away | Not Yet Rated | |
| Blue Ridge Elementary School PK-5 | 624 Students | 2.2 miles away | Not Yet Rated | |
| South Columbia Elementary School PK-5 | 510 Students | 2.9 miles away |  3.5 out of 5 | |
| Warren Road Elementary School PK-5 | 502 Students | 3.4 miles away |  5 out of 5 | |
| Riverside Elementary School PK-5 | 734 Students | 3.4 miles away | Not Yet Rated | |
| Martinez Elementary School PK-5 | 496 Students | 3.8 miles away | Not Yet Rated | |
| National Hills Elementary School PK-5 | 230 Students | 4.1 miles away | Not Yet Rated | |
| Merry Elementary School PK-5 | 341 Students | 4.3 miles away | Not Yet Rated | |
| Garrett Elementary School PK-5 | 296 Students | 4.5 miles away | Not Yet Rated | |
| Bel Air Elementary School PK-5 | 507 Students | 4.6 miles away |  1 out of 5 | |
Compare This School To Nearby Schools ->
School Community Forum

Join a discussion about Stevens Creek Elementary School and talk to others in the community including students, parents, teachers, and administrators.
Popular Discussion Topics
- Admissions and Registration Questions (e.g. Dress Code and Discipline Policy)
- School Calendar and Upcoming Events (e.g. Graduation)
- After School Programs, Extracurricular Activities, and Athletics (e.g. Football)
- News and Announcements (e.g. Yearbook and Class Supply List Details)
- Graduate and Alumni Events (e.g. Organizing Class Reunions)
Navigation
Can't Find What You Are Looking For?
Nearby Cities
Sponsored Links
K-12 Articles

Helping Your Learning Disabled Child
Thousands of children in America struggle to learn on a daily basis. Many of them have invisible...
Thousands of children in America struggle to learn on a daily basis. Many of them have invisible...

Keep Your Licensed Teen Safe This Summer
Every year hundreds of teenage drivers lose their lives in motor vehicle accidents. Statistics show...
Every year hundreds of teenage drivers lose their lives in motor vehicle accidents. Statistics show...

Summer Safety Tips to Keep Kids Safe
It won't be long until kids run from the school, shrieking in delight because they're free for the...
It won't be long until kids run from the school, shrieking in delight because they're free for the...