Mulberry Creek Elementary School
Rating
Not Available
Not Available

No Reviews Yet
Find Old Friends From Mulberry Creek Elementary School
Use the form below to search for alumni from Mulberry Creek Elementary School.
School Description
School Summary and Highlights
- Enrolls 549 preschool and elementary school students from grades PK-4
- Ranks 323rd out of 1,322 elementary schools in GA.
Additional Contact Information
- Mailing Address: P.o. Box 309, Cataula, GA 31804
School District Details
- Harris County School District
- Per-Pupil Spending: $9,288
- Graduation Rate: 83.5%
- Dropout Rate: 2.5%
- Students Per Teacher: 15.1
- Enrolled Students: 4,891
Faculty Details and Student Enrollment
Students and Faculty
- Total Students Enrolled: 549
- Total Full Time "Equivalent" Teachers: 34.5
- Average Student-To-Teacher Ratio: 15.9
Students Gender Breakdown
- Males: 290 (52.8%)
- Females: 259 (47.2%)
Free Lunch Student Eligibility Breakdown
- Eligible for Reduced Lunch: 30 (5.5%)
- Eligible for Free Lunch: 126 (23.0%)
- Eligible for Either Reduced or Free Lunch: 156 (28.4%)
Student Enrollment Distribution by Race / Ethnicity

| Number | Percent | |
|---|---|---|
| American Indian | 2 | 0.4% |
| Black | 47 | 8.6% |
| Asian | 5 | 0.9% |
| Hispanic | 24 | 4.4% |
| White | 462 | 84.2% |
Number of Students Per Grade
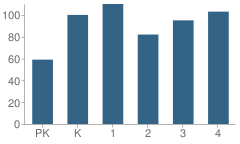
| Number | Percent | |
|---|---|---|
| Pre-Kindergarten | 59 | 10.7% |
| Kindergarten | 100 | 18.2% |
| 1st Grade | 110 | 20.0% |
| 2nd Grade | 82 | 14.9% |
| 3rd Grade | 95 | 17.3% |
| 4th Grade | 103 | 18.8% |
Source: GA Department of Education, Source: NCES 2009-2010
School Ratings and Reviews
Be The First To Review Mulberry Creek Elementary School!
School Map and Similar Schools Nearby
Click to Activate Map of Nearby School Campuses
Private
Public
This School
Similar Schools Nearby
| Creekside School 5-6 | 727 Students | 0.00 miles away | Not Yet Rated | |
| New Mountain Hill Elementary School PK-4 | 395 Students | 4.9 miles away |  5 out of 5 | |
| Pine Ridge Elementary School PK-4 | 532 Students | 6.6 miles away | 5 out of 5 | |
| Eagle Ridge Academy PK-5 | 661 Students | 8.2 miles away | Not Yet Rated | |
| Park Elementary School PK-4 | 447 Students | 8.6 miles away | 5 out of 5 | |
| Mathews Elementary School PK-5 | 490 Students | 8.8 miles away | Not Yet Rated | |
| Double Churches Elementary School PK-5 | 448 Students | 9.1 miles away | 5 out of 5 | |
| Midland Academy PK-5 | 598 Students | 9.2 miles away | Not Yet Rated | |
| North Columbus Elementary School PK-5 | 662 Students | 9.3 miles away | Not Yet Rated | |
| Blanchard Elementary School PK-5 | 565 Students | 9.4 miles away | 5 out of 5 | |
Compare This School To Nearby Schools ->
School Community Forum

Join a discussion about Mulberry Creek Elementary School and talk to others in the community including students, parents, teachers, and administrators.
Popular Discussion Topics
- Admissions and Registration Questions (e.g. Dress Code and Discipline Policy)
- School Calendar and Upcoming Events (e.g. Graduation)
- After School Programs, Extracurricular Activities, and Athletics (e.g. Football)
- News and Announcements (e.g. Yearbook and Class Supply List Details)
- Graduate and Alumni Events (e.g. Organizing Class Reunions)
Navigation
Can't Find What You Are Looking For?
Nearby Cities
Sponsored Links
K-12 Articles

Does Your Child's Teacher Make a Difference
School improvement is always in the news. Teachers demand smaller class sizes. The government calls...
School improvement is always in the news. Teachers demand smaller class sizes. The government calls...

Teacher Tenure: A Double-Edged Sword
Teacher Tenure (the policy making it almost impossible to fire teachers) has noble roots. It was...
Teacher Tenure (the policy making it almost impossible to fire teachers) has noble roots. It was...

Who is Safe?
Between September 26 and October 2, 2006, there were three deadly school shootings and...
Between September 26 and October 2, 2006, there were three deadly school shootings and...