Bartelso Elementary School
Rating
Not Available
Not Available

No Reviews Yet
Find Old Friends From Bartelso Elementary School
Use the form below to search for alumni from Bartelso Elementary School.
School Description
School Summary and Highlights
- Enrolls 143 preschool and elementary school students from grades PK-8
- Ranks 7th out of 1,366 middle schools in IL.
Additional Contact Information
- Mailing Address: PO Box 267, Bartelso, IL 62218
- Principal or Admin: Karen K Zellmer
School District Details
- Bartelso School District 57
- Per-Pupil Spending: $7,617
- Students Per Teacher: 13.0
- Enrolled Students: 143
Faculty Details and Student Enrollment
Students and Faculty
- Total Students Enrolled: 143
- Total Full Time "Equivalent" Teachers: 11.0
- Average Student-To-Teacher Ratio: 13.0
Students Gender Breakdown
- Males: 79 (55.2%)
- Females: 63 (44.1%)
Free Lunch Student Eligibility Breakdown
- Eligible for Reduced Lunch: - (-)
- Eligible for Free Lunch: 2 (1.4%)
- Eligible for Either Reduced or Free Lunch: 2 (1.4%)
Student Enrollment Distribution by Race / Ethnicity

| Number | Percent | |
|---|---|---|
| American Indian | - | - |
| Black | - | - |
| Asian | - | - |
| Hispanic | - | - |
| White | 142 | 99.3% |
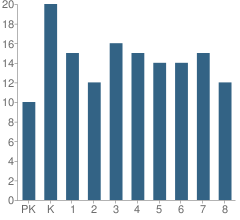
Number of Students Per Grade
| Number | Percent | |
|---|---|---|
| Pre-Kindergarten | 10 | 7.0% |
| Kindergarten | 20 | 14.0% |
| 1st Grade | 15 | 10.5% |
| 2nd Grade | 12 | 8.4% |
| 3rd Grade | 16 | 11.2% |
| 4th Grade | 15 | 10.5% |
| 5th Grade | 14 | 9.8% |
| 6th Grade | 14 | 9.8% |
| 7th Grade | 15 | 10.5% |
| 8th Grade | 12 | 8.4% |
Attendance, Graduation, and Dropout Rates (2010)
Attendance Rate
School:
97.2%
District:
97.2%
State:
93.9%
Source: IL Department of Education, Source: NCES 2009-2010
School Ratings and Reviews
Be The First To Review Bartelso Elementary School!
School Map and Similar Schools Nearby
Click to Activate Map of Nearby School Campuses
Private
Public
This School
Similar Schools Nearby
| Germantown Elementary School PK-8 | 267 Students | 3.9 miles away | Not Yet Rated | |
| Breese Elementary School PK-8 | 454 Students | 5.9 miles away | Not Yet Rated | |
| Carlyle Elementary School KG-4 | 442 Students | 7.7 miles away | Not Yet Rated | |
| Carlyle Junior High School 5-8 | 367 Students | 7.7 miles away |  3 out of 5 | |
| Albers Elementary School PK-8 | 203 Students | 8.0 miles away | Not Yet Rated | |
| Damiansville Elementary School PK-8 | 115 Students | 8.6 miles away | Not Yet Rated | |
| Okawville Grade School KG-5 | 226 Students | 8.7 miles away | Not Yet Rated | |
| Aviston Elementary School PK-8 | 381 Students | 9.2 miles away | Not Yet Rated | |
| St Rose Elementary School PK-8 | 178 Students | 11.3 miles away |  5 out of 5 | |
| Hoyleton Cons Elementary School KG-8 | 64 Students | 12.1 miles away | Not Yet Rated | |
Compare This School To Nearby Schools ->
School Community Forum

Join a discussion about Bartelso Elementary School and talk to others in the community including students, parents, teachers, and administrators.
Popular Discussion Topics
- Admissions and Registration Questions (e.g. Dress Code and Discipline Policy)
- School Calendar and Upcoming Events (e.g. Graduation)
- After School Programs, Extracurricular Activities, and Athletics (e.g. Football)
- News and Announcements (e.g. Yearbook and Class Supply List Details)
- Graduate and Alumni Events (e.g. Organizing Class Reunions)
Navigation
Can't Find What You Are Looking For?
Rankings
Nearby Cities
Sponsored Links
K-12 Articles

Assisting Students to Overcome Test Anxiety
Every human copes with anxiety at one time or another. It is a basic emotion that we feel when...
Every human copes with anxiety at one time or another. It is a basic emotion that we feel when...

Making Sense of No Child Left Behind
The No Child Left Behind Act of 2001 has met with mixed results and mixed feelings. Some think it...
The No Child Left Behind Act of 2001 has met with mixed results and mixed feelings. Some think it...

Keeping Our Kids Safe in the Post 9/11 World
Recently, radio talk show host and CNN personality did a week-long special entitled “The Perfect...
Recently, radio talk show host and CNN personality did a week-long special entitled “The Perfect...