Gard Elementary School
Rating
Not Available
Not Available

No Reviews Yet
Find Old Friends From Gard Elementary School
Use the form below to search for alumni from Gard Elementary School.
School Description
School Summary and Highlights
- Enrolls 477 elementary school students from grades KG-5
- Ranks 2110th out of 2,453 elementary schools in IL.
Additional Contact Information
- Mailing Address: 400 E 15th St, Beardstown, IL 62618
- Principal or Admin: Cheryl Summers
School Operational Details
- Title I Eligible
School District Details
- Beardstown Community Unit School District - Cusd 15
- Per-Pupil Spending: $7,273
- Graduation Rate: 73.8%
- Dropout Rate: 3.4%
- Students Per Teacher: 14.8
- Enrolled Students: 1,595
Faculty Details and Student Enrollment
Students and Faculty
- Total Students Enrolled: 477
- Total Full Time "Equivalent" Teachers: 38.0
- Average Student-To-Teacher Ratio: 12.6
Students Gender Breakdown
- Males: 219 (45.9%)
- Females: 206 (43.2%)
Free Lunch Student Eligibility Breakdown
- Eligible for Reduced Lunch: 52 (10.9%)
- Eligible for Free Lunch: 359 (75.3%)
- Eligible for Either Reduced or Free Lunch: 411 (86.2%)
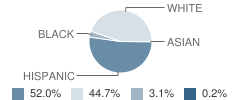
Student Enrollment Distribution by Race / Ethnicity
| Number | Percent | |
|---|---|---|
| American Indian | - | - |
| Black | 13 | 2.7% |
| Asian | 1 | 0.2% |
| Hispanic | 221 | 46.3% |
| White | 190 | 39.8% |
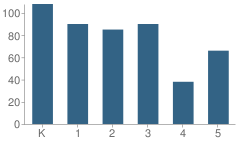
Number of Students Per Grade
| Number | Percent | |
|---|---|---|
| Kindergarten | 108 | 22.6% |
| 1st Grade | 90 | 18.9% |
| 2nd Grade | 85 | 17.8% |
| 3rd Grade | 90 | 18.9% |
| 4th Grade | 38 | 8.0% |
| 5th Grade | 66 | 13.8% |
Attendance, Graduation, and Dropout Rates (2010)
Attendance Rate
School:
94.5%
District:
93.3%
State:
93.9%
Teacher Credentials (2010)
Percent of Teachers with Emergency or Provisional Credentials
School:
8.6%
District:
5.1%
State:
0.5%
Source: IL Department of Education, Source: NCES 2009-2010
School Ratings and Reviews
Be The First To Review Gard Elementary School!
School Map and Similar Schools Nearby
Click to Activate Map of Nearby School Campuses
Private
Public
This School
Similar Schools Nearby
| Brick Elementary School 1-5 | 162 Students | 4.6 miles away | Not Yet Rated | |
| Washington Elementary School PK-1 | 209 Students | 10.5 miles away | Not Yet Rated | - |
| Webster Elementary School 2-4 | 208 Students | 11.0 miles away | Not Yet Rated | |
| Virginia Elementary School PK-5 | 223 Students | 11.6 miles away | Not Yet Rated | |
| Triopia Grade School PK-6 | 208 Students | 11.9 miles away |  5 out of 5 | |
| Meredosia-Chambersburg Elementary School PK-5 | 159 Students | 14.2 miles away | Not Yet Rated | |
| A-C Central Elementary School KG-4 | 169 Students | 14.6 miles away | Not Yet Rated | |
| Brown County Middle School 5-8 | 205 Students | 17.8 miles away | Not Yet Rated | |
| Brown County Elementary School PK-4 | 326 Students | 18.3 miles away | Not Yet Rated | |
| Bluffs Elementary School PK-5 | 124 Students | 18.7 miles away | Not Yet Rated | |
Compare This School To Nearby Schools ->
School Community Forum

Join a discussion about Gard Elementary School and talk to others in the community including students, parents, teachers, and administrators.
Popular Discussion Topics
- Admissions and Registration Questions (e.g. Dress Code and Discipline Policy)
- School Calendar and Upcoming Events (e.g. Graduation)
- After School Programs, Extracurricular Activities, and Athletics (e.g. Football)
- News and Announcements (e.g. Yearbook and Class Supply List Details)
- Graduate and Alumni Events (e.g. Organizing Class Reunions)
Navigation
Can't Find What You Are Looking For?
Rankings
Nearby Cities
Sponsored Links
K-12 Articles

Homework Tips: Taking the Work out of Homework
Kids hate homework. It seems that almost every night of the week they are overloaded with...
Kids hate homework. It seems that almost every night of the week they are overloaded with...

The Pros and Cons of Seat Belts in School Buses
Recently the news has been full of school bus accidents where children have been seriously injured...
Recently the news has been full of school bus accidents where children have been seriously injured...

School Lunches ... Hot or Cold?
First there were four, now there are six, no one knows how many more there may be in the future....
First there were four, now there are six, no one knows how many more there may be in the future....