Burnham Elementary School
Rating
Not Available
Not Available

No Reviews Yet
Find Old Friends From Burnham Elementary School
Use the form below to search for alumni from Burnham Elementary School.
School Description
School Summary and Highlights
- Enrolls 199 preschool and elementary school students from grades PK-8
- Ranks 924th out of 1,366 middle schools in IL.
Additional Contact Information
- Principal or Admin: Wendy Whited
School Operational Details
- Title I Eligible
School District Details
- Burnham School District 154-5
- Per-Pupil Spending: $7,664
- Students Per Teacher: 18.8
- Enrolled Students: 199
Faculty Details and Student Enrollment
Students and Faculty
- Total Students Enrolled: 199
- Total Full Time "Equivalent" Teachers: 10.6
- Average Student-To-Teacher Ratio: 18.8
Students Gender Breakdown
- Males: 87 (43.7%)
- Females: 112 (56.3%)
Free Lunch Student Eligibility Breakdown
- Eligible for Reduced Lunch: 24 (12.1%)
- Eligible for Free Lunch: 160 (80.4%)
- Eligible for Either Reduced or Free Lunch: 184 (92.5%)
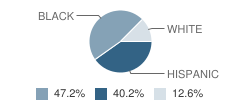
Student Enrollment Distribution by Race / Ethnicity
| Number | Percent | |
|---|---|---|
| American Indian | - | - |
| Black | 94 | 47.2% |
| Asian | - | - |
| Hispanic | 80 | 40.2% |
| White | 25 | 12.6% |
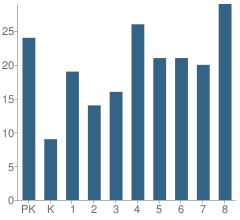
Number of Students Per Grade
| Number | Percent | |
|---|---|---|
| Pre-Kindergarten | 24 | 12.1% |
| Kindergarten | 9 | 4.5% |
| 1st Grade | 19 | 9.5% |
| 2nd Grade | 14 | 7.0% |
| 3rd Grade | 16 | 8.0% |
| 4th Grade | 26 | 13.1% |
| 5th Grade | 21 | 10.6% |
| 6th Grade | 21 | 10.6% |
| 7th Grade | 20 | 10.1% |
| 8th Grade | 29 | 14.6% |
Attendance, Graduation, and Dropout Rates (2010)
Attendance Rate
School:
94.2%
District:
94.2%
State:
93.9%
Source: IL Department of Education, Source: NCES 2009-2010
School Ratings and Reviews
Be The First To Review Burnham Elementary School!
School Map and Similar Schools Nearby
Click to Activate Map of Nearby School Campuses
Private
Public
This School
Similar Schools Nearby
| Clay Elementary School PK-8 | 695 Students | 0.9 miles away | Not Yet Rated | |
| Wentworth Intermediate School 3-5 | 427 Students | 1.5 miles away |  1 out of 5 | |
| Grissom Elementary School PK-8 | 318 Students | 1.6 miles away | Not Yet Rated | |
| Wilson Elementary School PK-2 | 377 Students | 1.7 miles away | Not Yet Rated | - |
| Caroline Sibley Elementary School PK-6 | 820 Students | 1.7 miles away |  5 out of 5 | |
| Carol Moseley Braun School 1-5 | 312 Students | 2.1 miles away | 1 out of 5 | |
| Lincoln Elementary School PK-8 | 1,130 Students | 2.2 miles away | 5 out of 5 | |
| Diekman Elementary School PK-5 | 334 Students | 2.6 miles away | 1 out of 5 | |
| Berger-Vandenberg Elementary School KG-5 | 373 Students | 2.6 miles away |  4 out of 5 | |
| New Beginnings Learning Academy KG-6 | 448 Students | 2.7 miles away | 5 out of 5 | |
Compare This School To Nearby Schools ->
School Community Forum

Join a discussion about Burnham Elementary School and talk to others in the community including students, parents, teachers, and administrators.
Popular Discussion Topics
- Admissions and Registration Questions (e.g. Dress Code and Discipline Policy)
- School Calendar and Upcoming Events (e.g. Graduation)
- After School Programs, Extracurricular Activities, and Athletics (e.g. Football)
- News and Announcements (e.g. Yearbook and Class Supply List Details)
- Graduate and Alumni Events (e.g. Organizing Class Reunions)
Navigation
Can't Find What You Are Looking For?
Rankings
Nearby Cities
Sponsored Links
K-12 Articles

National Memories
Few events are seared into our memory, and bring the country together-not as Democrat and...
Few events are seared into our memory, and bring the country together-not as Democrat and...

Democracy in Action
There is still over a year until the general election, but the election cycle has been in full...
There is still over a year until the general election, but the election cycle has been in full...

The Impact on Adopted Children at School
Children who are adopted can be affected both academically and socially at school. Many times...
Children who are adopted can be affected both academically and socially at school. Many times...