Barton Elementary School
Rating
Not Available
Not Available

No Reviews Yet
Find Old Friends From Barton Elementary School
Use the form below to search for alumni from Barton Elementary School.
School Description
School Summary and Highlights
- Enrolls 618 preschool and elementary school students from grades PK-8
- Ranks 1225th out of 1,366 middle schools in IL.
Additional Contact Information
- Mailing Address: 7650 S Wolcott Ave, Chicago, IL 60620
- Principal or Admin: Terrence Carter
School Operational Details
- Title I EligibleAll students of this school are eligible for participation in authorized programs.
School District Details
- Chicago Public Schools
- Per-Pupil Spending: $10,392
- Graduation Rate: 63.8%
- Dropout Rate: 16.3%
- Students Per Teacher: 17.8
- Enrolled Students: 406,068
Faculty Details and Student Enrollment
Students and Faculty
- Total Students Enrolled: 618
- Total Full Time "Equivalent" Teachers: 29.0
- Average Student-To-Teacher Ratio: 21.3
Students Gender Breakdown
- Males: 335 (54.2%)
- Females: 283 (45.8%)
Free Lunch Student Eligibility Breakdown
- Eligible for Reduced Lunch: 28 (4.5%)
- Eligible for Free Lunch: 586 (94.8%)
- Eligible for Either Reduced or Free Lunch: 614 (99.4%)
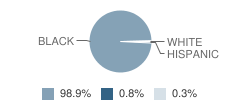
Student Enrollment Distribution by Race / Ethnicity
| Number | Percent | |
|---|---|---|
| American Indian | - | - |
| Black | 611 | 98.9% |
| Asian | - | - |
| Hispanic | 5 | 0.8% |
| White | 2 | 0.3% |
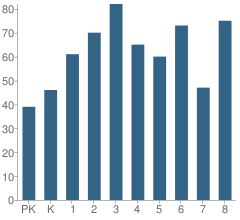
Number of Students Per Grade
| Number | Percent | |
|---|---|---|
| Pre-Kindergarten | 39 | 6.3% |
| Kindergarten | 46 | 7.4% |
| 1st Grade | 61 | 9.9% |
| 2nd Grade | 70 | 11.3% |
| 3rd Grade | 82 | 13.3% |
| 4th Grade | 65 | 10.5% |
| 5th Grade | 60 | 9.7% |
| 6th Grade | 73 | 11.8% |
| 7th Grade | 47 | 7.6% |
| 8th Grade | 75 | 12.1% |
Attendance, Graduation, and Dropout Rates (2010)
Attendance Rate
School:
92.2%
District:
91.5%
State:
93.9%
Source: IL Department of Education, Source: NCES 2009-2010
School Ratings and Reviews
Be The First To Review Barton Elementary School!
School Map and Similar Schools Nearby
Click to Activate Map of Nearby School Campuses
Private
Public
This School
Similar Schools Nearby
| Joplin Elementary School PK-8 | 576 Students | 0.4 miles away | Not Yet Rated | |
| Randolph Elementary School PK-8 | 678 Students | 0.4 miles away | Not Yet Rated | |
| Cook Elementary School PK-8 | 607 Students | 0.8 miles away | Not Yet Rated | |
| Altgeld Elementary School PK-8 | 598 Students | 1.0 miles away | Not Yet Rated | |
| Foster Park Elementary School PK-8 | 492 Students | 1.1 miles away |  5 out of 5 | |
| Davis M Magnet Elementary School PK-8 | 501 Students | 1.1 miles away | Not Yet Rated | |
| Stagg Elementary School PK-8 | 558 Students | 1.2 miles away | Not Yet Rated | |
| Bond Elementary School PK-8 | 383 Students | 1.2 miles away | Not Yet Rated | |
| Cuffe Math-Sciencetech Elementary Academy PK-8 | 558 Students | 1.2 miles away | Not Yet Rated | |
| Guggenheim Elementary School PK-8 | 262 Students | 1.3 miles away | 5 out of 5 | |
Compare This School To Nearby Schools ->
School Community Forum

Join a discussion about Barton Elementary School and talk to others in the community including students, parents, teachers, and administrators.
Popular Discussion Topics
- Admissions and Registration Questions (e.g. Dress Code and Discipline Policy)
- School Calendar and Upcoming Events (e.g. Graduation)
- After School Programs, Extracurricular Activities, and Athletics (e.g. Football)
- News and Announcements (e.g. Yearbook and Class Supply List Details)
- Graduate and Alumni Events (e.g. Organizing Class Reunions)
Navigation
Can't Find What You Are Looking For?
Rankings
Nearby Cities
Sponsored Links
K-12 Articles

Helping Your Child Leave the Nest
It’s all come down to this: Eighteen years of good times and bad, and now your baby bird is ready...
It’s all come down to this: Eighteen years of good times and bad, and now your baby bird is ready...

Breakfast, Kids and Learning
For generations parents have been telling their kids that breakfast is the most important meal of...
For generations parents have been telling their kids that breakfast is the most important meal of...

What to Do when Your Child Hates School
All kids grumble about going to school at one time or another. This is perfectly normal, but what...
All kids grumble about going to school at one time or another. This is perfectly normal, but what...