Nicholson Elementary Math & Science School
Rating
Not Available
Not Available

No Reviews Yet
Find Old Friends From Nicholson Elementary Math & Science School
Use the form below to search for alumni from Nicholson Elementary Math & Science School.
School Description
School Summary and Highlights
- Enrolls 475 preschool and elementary school students from grades PK-8
- Ranks 995th out of 1,366 middle schools in IL.
Additional Contact Information
- Mailing Address: 6006 S Peoria St, Chicago, IL 60621
- Principal or Admin: Rodney Hull
School Operational Details
- Title I EligibleAll students of this school are eligible for participation in authorized programs.
School District Details
- Chicago Public Schools
- Per-Pupil Spending: $10,392
- Graduation Rate: 63.8%
- Dropout Rate: 16.3%
- Students Per Teacher: 17.8
- Enrolled Students: 406,068
Faculty Details and Student Enrollment
Students and Faculty
- Total Students Enrolled: 475
- Total Full Time "Equivalent" Teachers: 27.0
- Average Student-To-Teacher Ratio: 17.6
Students Gender Breakdown
- Males: 245 (51.6%)
- Females: 230 (48.4%)
Free Lunch Student Eligibility Breakdown
- Eligible for Reduced Lunch: 3 (0.6%)
- Eligible for Free Lunch: 462 (97.3%)
- Eligible for Either Reduced or Free Lunch: 465 (97.9%)
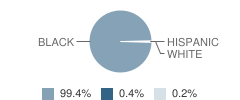
Student Enrollment Distribution by Race / Ethnicity
| Number | Percent | |
|---|---|---|
| American Indian | - | - |
| Black | 472 | 99.4% |
| Asian | - | - |
| Hispanic | 2 | 0.4% |
| White | 1 | 0.2% |
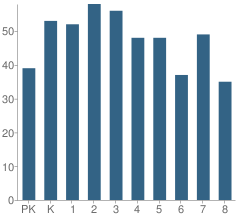
Number of Students Per Grade
| Number | Percent | |
|---|---|---|
| Pre-Kindergarten | 39 | 8.2% |
| Kindergarten | 53 | 11.2% |
| 1st Grade | 52 | 10.9% |
| 2nd Grade | 58 | 12.2% |
| 3rd Grade | 56 | 11.8% |
| 4th Grade | 48 | 10.1% |
| 5th Grade | 48 | 10.1% |
| 6th Grade | 37 | 7.8% |
| 7th Grade | 49 | 10.3% |
| 8th Grade | 35 | 7.4% |
Attendance, Graduation, and Dropout Rates (2010)
Attendance Rate
School:
92.0%
District:
91.5%
State:
93.9%
Teacher Credentials (2010)
Percent of Classes Not Taught by Highly Qualified Teachers
School:
10.0%
District:
3.0%
State:
0.7%
Source: IL Department of Education, Source: NCES 2009-2010
School Ratings and Reviews
Be The First To Review Nicholson Elementary Math & Science School!
School Map and Similar Schools Nearby
Click to Activate Map of Nearby School Campuses
Private
Public
This School
Similar Schools Nearby
| Woods Elementary Math & Science Academy PK-8 | 477 Students | 0.5 miles away |  4 out of 5 | |
| Copernicus Elementary School PK-8 | 349 Students | 0.5 miles away | Not Yet Rated | |
| Bontemps Elementary School PK-8 | 366 Students | 0.5 miles away | Not Yet Rated | |
| Holmes Elementary School PK-8 | 400 Students | 0.6 miles away | Not Yet Rated | |
| Kershaw Elementary School PK-8 | 223 Students | 0.6 miles away |  5 out of 5 | |
| Reed Elementary School 1-8 | 218 Students | 0.8 miles away | Not Yet Rated | |
| Dewey Elementary Academy of Fine Arts PK-8 | 419 Students | 0.8 miles away | Not Yet Rated | |
| Bass Elementary School PK-8 | 411 Students | 0.8 miles away | Not Yet Rated | |
| Mays Elementary Academy KG-8 | 343 Students | 0.9 miles away | 5 out of 5 | |
| Sherwood Elementary School PK-8 | 408 Students | 0.9 miles away | Not Yet Rated | |
Compare This School To Nearby Schools ->
School Community Forum

Join a discussion about Nicholson Elementary Math & Science School and talk to others in the community including students, parents, teachers, and administrators.
Popular Discussion Topics
- Admissions and Registration Questions (e.g. Dress Code and Discipline Policy)
- School Calendar and Upcoming Events (e.g. Graduation)
- After School Programs, Extracurricular Activities, and Athletics (e.g. Football)
- News and Announcements (e.g. Yearbook and Class Supply List Details)
- Graduate and Alumni Events (e.g. Organizing Class Reunions)
Navigation
Can't Find What You Are Looking For?
Rankings
Nearby Cities
Sponsored Links
K-12 Articles

Summer Advice
A few weeks ago, at the weekly after-school program I run through my local church, a group of...
A few weeks ago, at the weekly after-school program I run through my local church, a group of...

The Impact on Adopted Children at School
Children who are adopted can be affected both academically and socially at school. Many times...
Children who are adopted can be affected both academically and socially at school. Many times...

How to Get the Best Supplies for Your Money
School supply lists can seem unending, and the price can add up very quickly. But do we really...
School supply lists can seem unending, and the price can add up very quickly. But do we really...