Brunson Math & Science Specialty Elementary School
Rating
Not Available
Not Available

No Reviews Yet
Find Old Friends From Brunson Math & Science Specialty Elementary School
Use the form below to search for alumni from Brunson Math & Science Specialty Elementary School.
School Description
School Summary and Highlights
- Enrolls 682 preschool and elementary school students from grades PK-8
- Ranks 1245th out of 1,366 middle schools in IL.
Additional Contact Information
- Mailing Address: 932 N Central Ave, Chicago, IL 60651
- Principal or Admin: Carol Wilson
School Operational Details
- Title I EligibleAll students of this school are eligible for participation in authorized programs.
School District Details
- Chicago Public Schools
- Per-Pupil Spending: $10,392
- Graduation Rate: 63.8%
- Dropout Rate: 16.3%
- Students Per Teacher: 17.8
- Enrolled Students: 406,068
Faculty Details and Student Enrollment
Students and Faculty
- Total Students Enrolled: 682
- Total Full Time "Equivalent" Teachers: 38.0
- Average Student-To-Teacher Ratio: 18.0
Students Gender Breakdown
- Males: 356 (52.2%)
- Females: 326 (47.8%)
Free Lunch Student Eligibility Breakdown
- Eligible for Reduced Lunch: 24 (3.5%)
- Eligible for Free Lunch: 628 (92.1%)
- Eligible for Either Reduced or Free Lunch: 652 (95.6%)
Student Enrollment Distribution by Race / Ethnicity
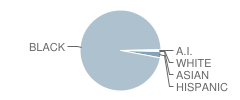
| Number | Percent | |
|---|---|---|
| American Indian | 2 | 0.3% |
| Black | 660 | 96.8% |
| Asian | 1 | 0.1% |
| Hispanic | 17 | 2.5% |
| White | 2 | 0.3% |
Number of Students Per Grade
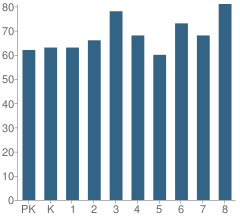
| Number | Percent | |
|---|---|---|
| Pre-Kindergarten | 62 | 9.1% |
| Kindergarten | 63 | 9.2% |
| 1st Grade | 63 | 9.2% |
| 2nd Grade | 66 | 9.7% |
| 3rd Grade | 78 | 11.4% |
| 4th Grade | 68 | 10.0% |
| 5th Grade | 60 | 8.8% |
| 6th Grade | 73 | 10.7% |
| 7th Grade | 68 | 10.0% |
| 8th Grade | 81 | 11.9% |
Attendance, Graduation, and Dropout Rates (2010)
Attendance Rate
School:
91.6%
District:
91.5%
State:
93.9%
Source: IL Department of Education, Source: NCES 2009-2010
School Ratings and Reviews
Be The First To Review Brunson Math & Science Specialty Elementary School!
School Map and Similar Schools Nearby
Click to Activate Map of Nearby School Campuses
Private
Public
This School
Similar Schools Nearby
| Howe Elementary School PK-8 | 544 Students | 0.4 miles away | Not Yet Rated | |
| Hay Elementary Community Academy PK-8 | 637 Students | 0.5 miles away | Not Yet Rated | |
| Key Elementary School KG-8 | 364 Students | 0.6 miles away | Not Yet Rated | |
| Young Elementary School PK-8 | 1,341 Students | 0.6 miles away | Not Yet Rated | |
| Lewis Elementary School PK-8 | 684 Students | 0.8 miles away | Not Yet Rated | |
| Whittier Elementary School PK-5 | 427 Students | 0.8 miles away | Not Yet Rated | |
| Ellington Elementary School PK-8 | 461 Students | 0.9 miles away | Not Yet Rated | |
| May Elementary Community Academy PK-8 | 497 Students | 0.9 miles away |  2.5 out of 5 | |
| Mcnair Elementary School PK-8 | 516 Students | 1.0 miles away | Not Yet Rated | |
| Nash Elementary School PK-8 | 485 Students | 1.0 miles away |  3.5 out of 5 | |
Compare This School To Nearby Schools ->
School Community Forum

Join a discussion about Brunson Math & Science Specialty Elementary School and talk to others in the community including students, parents, teachers, and administrators.
Popular Discussion Topics
- Admissions and Registration Questions (e.g. Dress Code and Discipline Policy)
- School Calendar and Upcoming Events (e.g. Graduation)
- After School Programs, Extracurricular Activities, and Athletics (e.g. Football)
- News and Announcements (e.g. Yearbook and Class Supply List Details)
- Graduate and Alumni Events (e.g. Organizing Class Reunions)
Navigation
Can't Find What You Are Looking For?
Rankings
Nearby Cities
Sponsored Links
K-12 Articles

Halloween Safety Tips
Ghosts and witches sit beside mistletoe and tinsel on store shelves. Orange and black deck the...
Ghosts and witches sit beside mistletoe and tinsel on store shelves. Orange and black deck the...

Teacher Tenure: A Double-Edged Sword
Teacher Tenure (the policy making it almost impossible to fire teachers) has noble roots. It was...
Teacher Tenure (the policy making it almost impossible to fire teachers) has noble roots. It was...

Educators and Childhood Obesity
Obesity in childhood is rising to epidemic proportions in America and educators should be...
Obesity in childhood is rising to epidemic proportions in America and educators should be...