Carroll Elementary School
Rating
Not Available
Not Available

No Reviews Yet
Find Old Friends From Carroll Elementary School
Use the form below to search for alumni from Carroll Elementary School.
School Description
School Summary and Highlights
- Enrolls 633 preschool and elementary school students from grades PK-8
- Ranks 1000th out of 1,366 middle schools in IL.
Additional Contact Information
- Mailing Address: 2929 W 83rd St, Chicago, IL 60652
- Principal or Admin: Adell Brock
School Operational Details
- Title I EligibleAll students of this school are eligible for participation in authorized programs.
School District Details
- Chicago Public Schools
- Per-Pupil Spending: $10,392
- Graduation Rate: 63.8%
- Dropout Rate: 16.3%
- Students Per Teacher: 17.8
- Enrolled Students: 406,068
Faculty Details and Student Enrollment
Students and Faculty
- Total Students Enrolled: 633
- Total Full Time "Equivalent" Teachers: 34.0
- Average Student-To-Teacher Ratio: 18.6
Students Gender Breakdown
- Males: 338 (53.4%)
- Females: 295 (46.6%)
Free Lunch Student Eligibility Breakdown
- Eligible for Reduced Lunch: 57 (9.0%)
- Eligible for Free Lunch: 469 (74.1%)
- Eligible for Either Reduced or Free Lunch: 526 (83.1%)
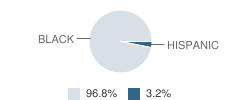
Student Enrollment Distribution by Race / Ethnicity
| Number | Percent | |
|---|---|---|
| American Indian | - | - |
| Black | 613 | 96.8% |
| Asian | - | - |
| Hispanic | 20 | 3.2% |
| White | - | - |
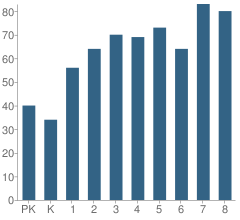
Number of Students Per Grade
| Number | Percent | |
|---|---|---|
| Pre-Kindergarten | 40 | 6.3% |
| Kindergarten | 34 | 5.4% |
| 1st Grade | 56 | 8.8% |
| 2nd Grade | 64 | 10.1% |
| 3rd Grade | 70 | 11.1% |
| 4th Grade | 69 | 10.9% |
| 5th Grade | 73 | 11.5% |
| 6th Grade | 64 | 10.1% |
| 7th Grade | 83 | 13.1% |
| 8th Grade | 80 | 12.6% |
Attendance, Graduation, and Dropout Rates (2010)
Attendance Rate
School:
95.4%
District:
91.5%
State:
93.9%
Teacher Credentials (2010)
Percent of Teachers with Emergency or Provisional Credentials
School:
3.3%
District:
1.2%
State:
0.5%
Source: IL Department of Education, Source: NCES 2009-2010
School Ratings and Reviews
Be The First To Review Carroll Elementary School!
School Map and Similar Schools Nearby
Click to Activate Map of Nearby School Campuses
Private
Public
This School
Similar Schools Nearby
| Owen Elementary Scholastic Academy KG-8 | 247 Students | 0.5 miles away | Not Yet Rated | |
| Ashburn Community Elementary School PK-8 | 510 Students | 0.7 miles away | Not Yet Rated | |
| Northeast Elementary School PK-6 | 464 Students | 1.0 miles away | Not Yet Rated | |
| Hampton Elementary Fine & Perf Arts School PK-8 | 722 Students | 1.0 miles away | Not Yet Rated | |
| Dawes Elementary School PK-8 | 1,155 Students | 1.1 miles away | Not Yet Rated | |
| Northwest School KG-6 | 308 Students | 1.4 miles away | Not Yet Rated | |
| Joplin Elementary School PK-8 | 576 Students | 1.5 miles away | Not Yet Rated | |
| Foster Park Elementary School PK-8 | 492 Students | 1.5 miles away |  5 out of 5 | |
| Kellogg Elementary School KG-8 | 274 Students | 1.5 miles away | Not Yet Rated | |
| Barton Elementary School PK-8 | 618 Students | 1.5 miles away | Not Yet Rated | |
Compare This School To Nearby Schools ->
School Community Forum

Join a discussion about Carroll Elementary School and talk to others in the community including students, parents, teachers, and administrators.
Popular Discussion Topics
- Admissions and Registration Questions (e.g. Dress Code and Discipline Policy)
- School Calendar and Upcoming Events (e.g. Graduation)
- After School Programs, Extracurricular Activities, and Athletics (e.g. Football)
- News and Announcements (e.g. Yearbook and Class Supply List Details)
- Graduate and Alumni Events (e.g. Organizing Class Reunions)
Navigation
Can't Find What You Are Looking For?
Rankings
Nearby Cities
Sponsored Links
K-12 Articles

Keep Kids Learning All Summer
Early in the 20th century schools in urban districts operated all year ‘round. However, in rural...
Early in the 20th century schools in urban districts operated all year ‘round. However, in rural...

Summer Advice
A few weeks ago, at the weekly after-school program I run through my local church, a group of...
A few weeks ago, at the weekly after-school program I run through my local church, a group of...

Those Pesky Little Transitions
Transitions are rarely easy, yet we have to encounter them every day of our lives. For school-aged...
Transitions are rarely easy, yet we have to encounter them every day of our lives. For school-aged...